Picking the best tools for AI agent session logging tends to happen after an incident, not before. A support agent issues the wrong refund on turn six of a conversation, and nobody can say which step, tool call or sub-agent decided it, or whether the agent was even allowed to. That is a session logging problem, and it sits at the center of AI agent governance.
LangChain’s State of Agent Engineering survey of 1,340 respondents found that 89% of organizations have some form of observability for their agents, but only 62% have detailed tracing that lets them inspect individual steps and tool calls.
Six tools cover that gap: Opencontroller by Lyzr, Langfuse, Arize Phoenix and Arize AX, Comet Opik, LangSmith, and Braintrust.
TL;DR
- Opencontroller (Lyzr): the only one of the six documented to enforce policy in the request path, tying every action to an identity.
- Langfuse: MIT-licensed tracing with session replay, self-hostable on every tier.
- Arize Phoenix and Arize AX: OpenTelemetry-based tracing with session views, plus the hosted Arize AX platform.
- Comet Opik: Apache 2.0 tracing with conversation threads and built-in LLM-as-a-judge evaluation.
- LangSmith: thread-level tracing that works beyond LangChain, with self-hosting reserved for Enterprise.
- Braintrust: traces tied to evaluation, with a hybrid option for data in your cloud.
What is AI agent session logging?
AI agent session logging is the practice of recording everything an agent does across one multi-turn interaction, including model calls, tool calls with their inputs and outputs, sub-agent handoffs, token counts and latency, under a single session ID so teams can replay and debug decisions.
If the record can’t show what the agent retrieved, which tool it called and where a sub-agent took over, you are archiving outputs, not logging a session. The session trace tree below shows the shape: one session, several turns, and under each turn the model calls, tool calls and handoffs.
Keep full inputs and outputs for decision points and errors. One field often goes missing: which agent identity, under which policy, took each step. It decides whether a log helps an engineer debug or helps an auditor sign off.
Not sure your team could answer that today? The Agent Governance Maturity Assessment scores your readiness in about six minutes:
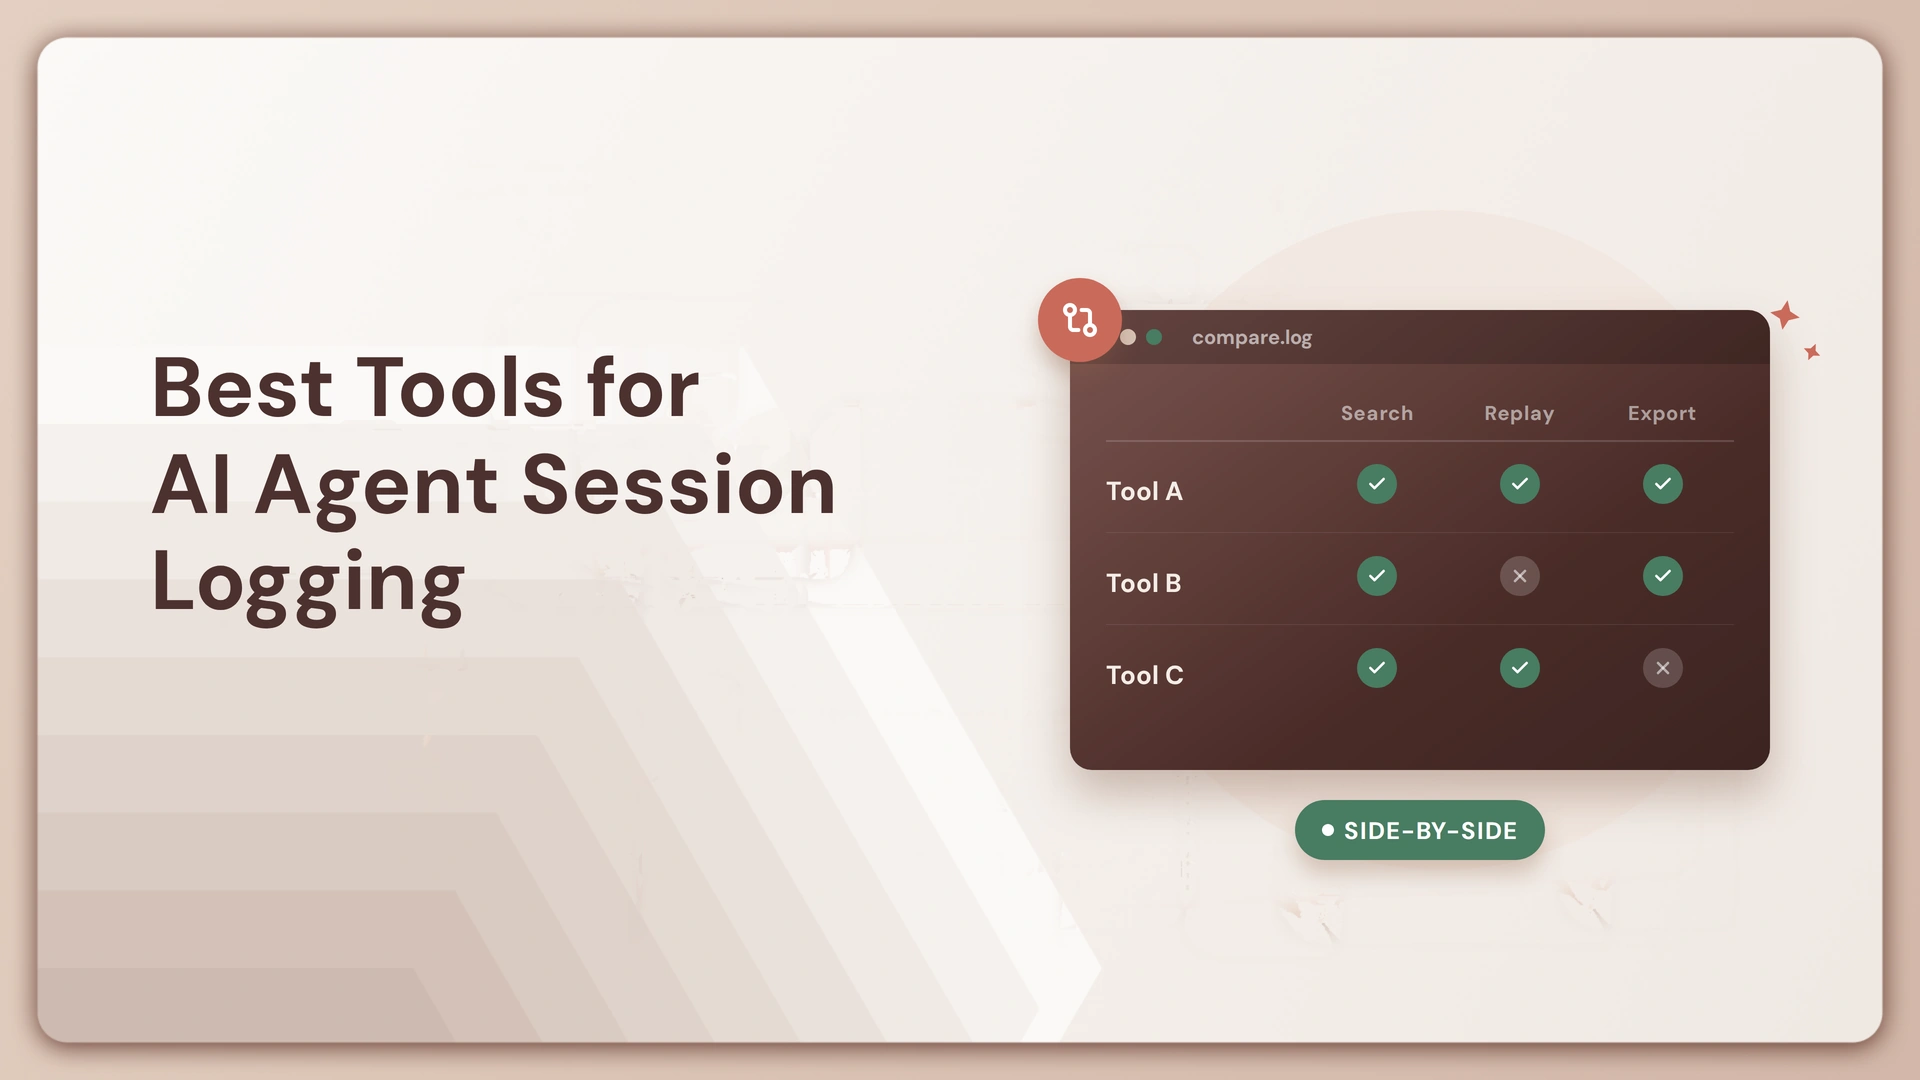
Master comparison: 6 tools for AI agent session logging
This table lines up the six tools on what a platform or security team asks first, ending with the two rows that decide whether logs double as governance. “Not documented” means the vendor’s own documentation doesn’t confirm it.
| Capability | Opencontroller (Lyzr) | Langfuse | Arize Phoenix / AX | Comet Opik | LangSmith | Braintrust |
| License and openness | Not documented | MIT core; governance add-ons commercial | Phoenix: Elastic License 2.0 (source-available); AX: hosted platform | Apache 2.0 | Commercial platform | Commercial platform |
| Hosting | Runs inside your cloud, alongside existing infrastructure | Cloud or self-hosted on every tier | Phoenix: self-host via pip, Docker or Helm; AX: managed | Self-host via Docker Compose or Kubernetes | Cloud; self-hosted is an Enterprise add-on | Cloud; self-hosted (Enterprise) or bring-your-own-cloud |
| Native session or thread grouping | Not documented | Yes (Sessions) | Yes (Sessions) | Yes (Threads) | Yes (Threads) | Yes (Thread view across traces grouped by metadata or tags) |
| Trace depth | Agent activity and access attempts; span-level depth not documented | Traces with nested observations | OpenTelemetry spans | Full trace trees for multi-step agents and tool calls | Nested calls | Hierarchical spans for LLM and tool calls |
| Token, cost and latency data | Usage, cost and performance signals; controls on what agents can spend | Token and cost tracking, with dashboards and spend alerts | Token usage and latency per conversation | Token usage and estimated cost per span and trace | Latency and token counts | Token usage and cost on LLM spans |
| Built-in evaluation | Evaluation and validation before production | LLM-as-a-judge, experiments, session scores | Evals, datasets, experiments | Datasets, experiments, LLM-as-a-judge metrics | Dataset and scoring workflow | Core focus (scorers, experiments) |
| OpenTelemetry and framework support | Any framework, model, cloud and runtime | OpenTelemetry integration | OpenTelemetry and OpenInference; LangGraph, CrewAI, LlamaIndex and more | OpenTelemetry SDK support; many framework integrations | OpenTelemetry support; works beyond LangChain | OpenTelemetry ingestion |
| Who access control applies to | Agents: who can run them, what they can spend and access | Platform users; project-level RBAC is commercial | Platform users (admin, member, viewer) | Platform users; custom roles on Enterprise | Platform users; RBAC is an Enterprise feature | Platform users and permission groups; SSO/SAML |
| Policy enforcement on agent actions | Yes, in the request path; refuses calls when policy says no | Not documented | Not documented | Not documented | Not documented | Not documented |
For broader monitoring, see our AI agent observability platforms guide.
The 6 session logging tools compared: strengths, limits and best fit
Lyzr approaches the problem from the governance side, while the other five are built around tracing and evaluation. Every entry states its trade-offs.
1. Opencontroller by Lyzr: session accountability in the request path
Opencontroller governs agents that already run, so every action is tied to an identity and checked against policy. It sits in the request path, so it can refuse a call instead of only noting it afterward. Lyzr’s own summary: “Every identity attributable. Every decision traceable. Every policy enforceable.”
Key features
- Identity attribution, so every agent action can be traced back to a specific agent identity
- Policy enforcement in the request path, including refusing a call when policy says no
- Controls over who can run an agent, what it can spend and what it can access
- Automatic discovery of agents, models, tools, data and workflows across your whole AI estate
- Ordered promotion and separation of duties on production, so changes reach live agents in a controlled sequence
Strengths and weaknesses
- Answers “which agent did this, and was it allowed” from one control point, which is what an auditor or security team needs before they will sign off on an agent
- Stops a non-compliant call in the request path, where a dashboard can only report the problem after it has happened
- Runs inside your cloud with no traffic to the vendor, so agent activity stays within your own environment
- Governs agents you already built, in their existing containers and repositories, with no rewrite required
- Works across any cloud, framework, model and runtime, so a single governance layer covers a mixed agent estate
- Monitors agents, applications, APIs and infrastructure in real time from one control plane, so usage, performance, cost and security signals sit in one place
- Keeps immutable versions, and rollback is a pointer move, so reverting a bad agent release is quick
- Evaluates and validates agents and workflows before they reach production, so governance starts before deployment rather than after an incident
- One limit to note: Opencontroller does not build or package containers, so your team keeps building and shipping agents the way it does today and Opencontroller governs them where they already run
Best for: platform and security teams running many agents across clouds and frameworks who must answer for each agent’s actions.
2. Langfuse: open-source tracing you can host yourself
Langfuse groups traces under a session ID, so a multi-turn conversation reads as one replayable interaction. The core is MIT licensed, and ClickHouse, which acquired the project in January 2026, says it remains open source. See our open-source LLM observability comparison.
Key features
- Session replay that lets you step back through every trace grouped under one session ID
- Session-level scores, added through the SDK or API or entered by reviewers in the UI, so whole conversations can be graded by people or pipelines
- Evaluation tooling, including LLM-as-a-judge and experiments, that runs on the same trace data you already collect
- Self-hosting on every tier, with no usage fee for running it yourself
Strengths
- Session replay and session-level scoring ship in the MIT-licensed core rather than behind a paid tier
- Teams keep full control of trace data because the whole stack can run on their own infrastructure
- Token and cost tracking comes with dashboards and spend alerts, so you can watch cost by model, user or tag as usage grows
Weaknesses
- Audit logs, project-level RBAC and data retention policies sit under a separate commercial license
- The Docker Compose setup lacks high availability, scaling and backup, so production deployments need Kubernetes with Helm or a cloud Terraform template
- It observes and evaluates agents but does not host or run them, so runtime control is out of scope
Best for: teams that need session replay and want trace data kept on their own infrastructure.
3. Arize Phoenix and Arize AX: OpenTelemetry-first tracing
Phoenix ties traces together when spans share a session ID. It is built on OpenTelemetry and OpenInference, and Arize AX is Arize’s hosted platform.
Key features
- Searchable session views that show the conversation history of a multi-turn application
- Instrumentation built on OpenTelemetry and OpenInference rather than a proprietary SDK
- Integrations with LangGraph, CrewAI, the OpenAI Agents SDK and other frameworks
- Self-hosting through pip, Docker or Helm, plus local runs for quick trials
Strengths
- Vendor-neutral instrumentation keeps your traces portable if you change backends later
- Evals, datasets and experiments sit beside traces, so debugging and testing share one tool
- Token usage and latency are tracked per conversation, not only per individual call
Weaknesses
- Elastic License 2.0 is source-available and bars offering the software as a hosted service
- Sessions only exist where your spans carry a session ID, so the tagging work is yours
- Access control is three user roles (admin, member, viewer), not policy over agent behavior
Best for: teams already emitting OpenTelemetry data who want session views without adopting a proprietary SDK.
4. Comet Opik: Apache-licensed tracing with conversation threads
Opik gathers traces that share a thread_id into one conversation and shows full trace trees for multi-step agents and tool calls. The platform is Apache 2.0 and can run in your own infrastructure.
Key features
- Threads that group traces sharing a thread_id into a single conversation view
- Estimated cost in USD calculated for each LLM span and rolled up into a total for the trace, alongside timing
- Datasets, experiments and LLM-as-a-judge metrics for evaluating agent behavior
- Integrations ranging from OpenAI and LangChain to Google ADK
Strengths
- The permissive Apache 2.0 license covers the whole platform, including self-hosted deployments
- Tracing, conversation threads and evaluation live in one tool instead of three separate ones
- It deploys with Docker Compose for development or Helm for production
Weaknesses
- Custom roles require an Enterprise plan, so finer-grained access control is not free
- You assign thread IDs yourself, so threads are only as clean as your tagging
- Docker Compose is meant for development, so production use means running Kubernetes
Best for: teams that want permissively licensed tracing and multi-turn evaluation in a single self-hostable tool.
5. LangSmith: thread-level tracing beyond LangChain
LangSmith links traces into a thread when they carry a session_id or thread_id in metadata. It captures prompts, responses, latency, token counts and nested calls, and, per LangChain, works outside the LangChain ecosystem.
Key features
- Threads formed from traces that share a session_id or thread_id in their metadata
- Nested calls captured with latency and token counts for each step
- Tracing that can also be sent in through OpenTelemetry
- Dataset and scoring workflows for evaluating agent output
Strengths
- Tracing is automatic for LangChain and LangGraph applications, with very little setup
- It also accepts other frameworks and custom code, so it is not locked to one stack
- It is hosted by default, so there is no infrastructure to run to get started
Weaknesses
- Self-hosting is an add-on to the Enterprise plan, so smaller teams stay on the hosted service
- RBAC is Enterprise-only, and on other plans every user defaults to the Admin role
- LangChain’s guide says it will not replace an APM for infrastructure incident triage
Best for: teams on LangChain or LangGraph, or any team happy to use a managed service.
6. Braintrust: session logs tied to evaluation
Braintrust records a trace as one end-to-end execution built from spans. LLM spans show model, messages, token usage and cost.
Key features
- Spans that capture LLM calls and tool calls, with parameters, token usage and cost
- Cost that rolls up from child spans to parent spans across a multi-step workflow
- A Thread view that reads related traces as one multi-turn conversation
- OpenTelemetry ingestion for traces and logs from your existing instrumentation
Strengths
- Logging and evaluation share one workflow, so every logged session can feed a test
- Hybrid deployment keeps the data plane, including logs and traces, in your own cloud
- SOC 2 Type II, HIPAA support and SSO/SAML come built in for enterprise security reviews
Weaknesses
- Self-hosting is limited to the Enterprise plan
- Session grouping relies on metadata or tags that you add yourself
- Evaluation-first design adds concepts that logging-only teams may not need
Best for: teams that want every logged session to feed evaluation.
Choosing between tracing, governance or both
Every tracing tool above answers one question well: what happened inside this run. Their access controls govern who can view or administer the platform, and their docs do not describe enforcing what an agent may do while it runs.
If your open question is why an agent said what it said, start with a tracing tool. If it is who let the agent do that, under which identity and policy, that is what Opencontroller is built for, and of these six it is the one documented to enforce policy in the request path. Most teams need both answered; the decision is which is unanswered today.
Find the gap with the AI Agent Sprawl Audit, then book a demo to see how Opencontroller holds up against your auditors’ actual questions.
FAQ
Opencontroller by Lyzr is the strongest fit when accountability matters, since it ties each agent action to an identity and a policy. Langfuse, Arize Phoenix, Comet Opik, LangSmith and Braintrust log agent sessions, with open-source options for self-hosting and managed ones for less infrastructure.
Application logs record separate events. Session logs group every model call, tool call and handoff of a multi-turn interaction under one ID, so you can replay the decision path. Non-deterministic agents can take different routes on the same input, which flat logs miss.
No. LangChain says LangSmith is not limited to LangChain or LangGraph, and it accepts traces from other frameworks and custom code, including through OpenTelemetry. Tracing is automatic with LangChain and LangGraph.
Not necessarily. Keep full inputs and outputs at decision points and errors, and lighter records elsewhere. Prompts and tool outputs can hold personal data, so decide what gets redacted before logs leave your environment.
Only partly. A session log shows what happened. An audit trail also shows which identity acted, under which policy, and whether the action was permitted. Opencontroller is built around that second part, with attributable identities and request-path enforcement.
Book A Demo: Click Here
Join our Slack: Click Here
Link to our GitHub: Click Here