TL;DR
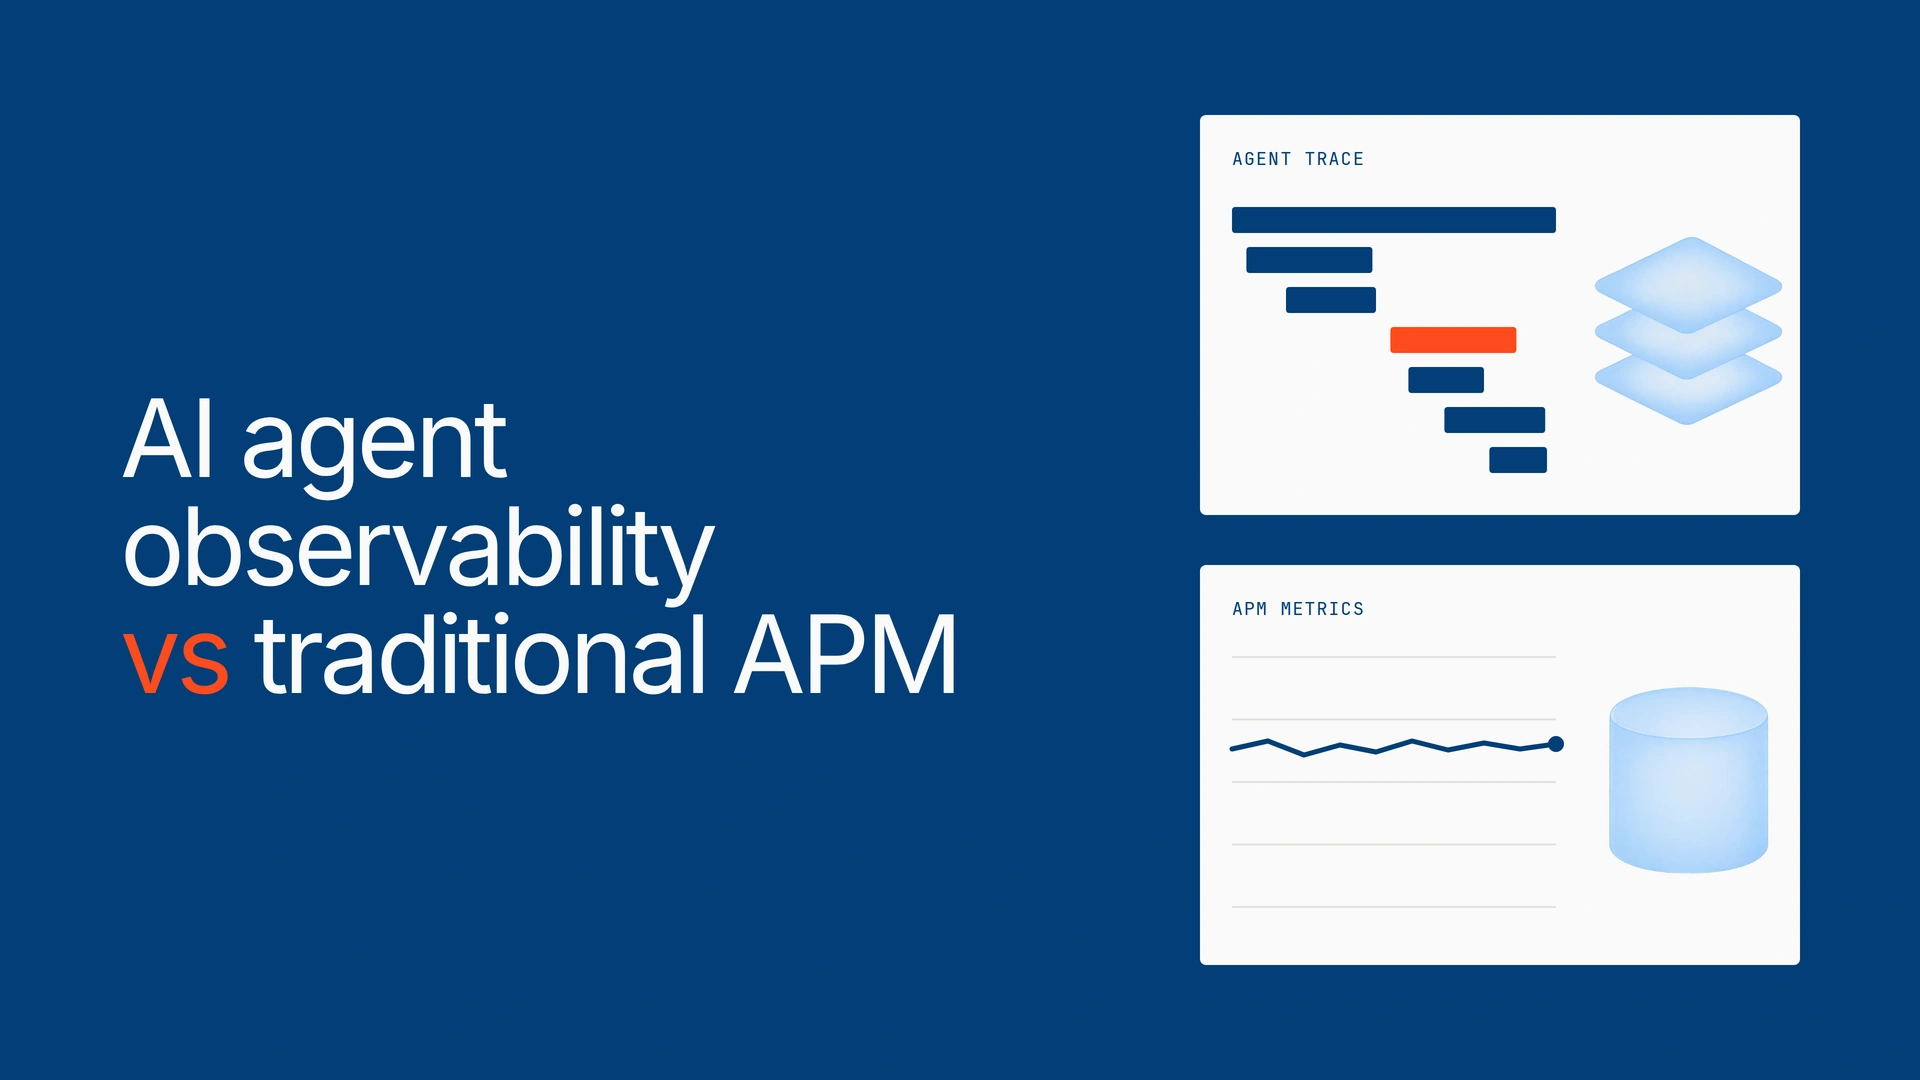
- The difference: AI agent observability vs traditional APM comes down to two questions. APM asks if services are up, fast and error-free. Agent observability asks if the agent did the right thing.
- The blind spot: an agent can return 200 OK, on time, with a wrong answer. APM sees a healthy request.
- What changes: what you trace, what you capture, how you detect failure, what you sample and how you count cost.
- What stays: keep APM for infrastructure, and join both layers with one trace ID.
- What’s missing: observability records bad decisions. Stopping the next one takes control in the request path.
You run platform engineering at a fintech, and your APM is good: golden-signal dashboards, clear SLOs, a pager rotation that works. Then on Monday, finance finds the problem, not your pager.
Over the weekend, the refund agent approved out-of-policy refunds, and the reconciliation agent ran up several times its usual model bill. The dashboards show a flat error rate, normal latency and healthy pods all weekend.
Nothing was down. Everything was wrong. That gap is what AI agent observability is for. Here’s what it changes, and what it doesn’t.
What traditional APM was built to answer
Application performance monitoring tells you whether software is available, fast and error-free, and which service caused a problem. It works because traditional code is deterministic: the same input takes the same path, and failures announce themselves.
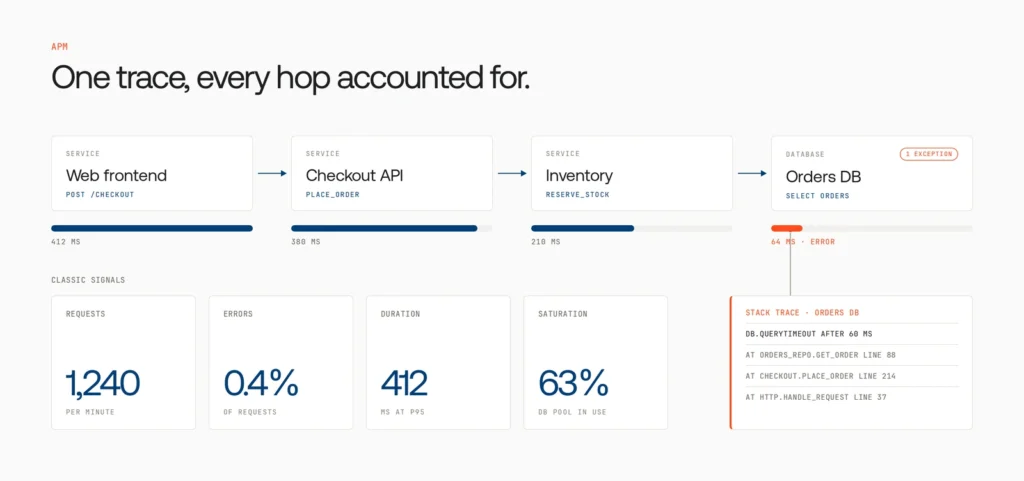
APM is still the best tool for that job, and its threshold alerts work because “bad” has a number, like a 5xx rate above 1%.
Underneath sits one assumption: a failure produces a signal. If nothing threw, the request succeeded. The weekend’s costly failures never threw.
AI agent observability vs traditional APM: what changes
APM watches services. Agent observability watches decisions: what the agent planned, which tools it called, what it retrieved, and whether the outcome was right.
| Dimension | Traditional APM | AI agent observability |
| Primary question | Is the service up, fast and error-free? | Did the agent do the right thing, and was the answer correct? |
| Execution | Deterministic: fixed code paths | Non-deterministic: the agent plans, picks tools and changes course at runtime |
| Unit of work | A request across services | A run or session: many model calls, tool calls and handoffs |
| What counts as failure | 5xx errors, exceptions, timeouts, saturation | Wrong answers, hallucinations, wrong tool or arguments, loops, policy breaches, often with a 200 OK |
| Key telemetry | CPU, memory, latency, throughput, stack traces | Prompts and versions, model and parameters, tokens, tool inputs and outputs, retrieved context, eval scores |
| Detection | Thresholds and exception alerts | Evals (rules, LLM judges, human review) attached to traces |
| Sampling | Keep errors and slow traces, drop most of the rest | Keep low-scoring, costly and unusual runs; errors alone miss most failures |
| Cost signal | Compute per host or service | Tokens and spend per run, agent and team |
| Data sensitivity | Mostly metadata | Prompts and outputs can hold customer data, so capture needs a policy |
The first five rows explain your weekend. The last four are where APM habits quietly mislead you.
Why a 200 OK stops meaning success
With an agent, the HTTP layer only tells you that a response came back. Whether it was right is a separate question that the HTTP layer can’t answer.
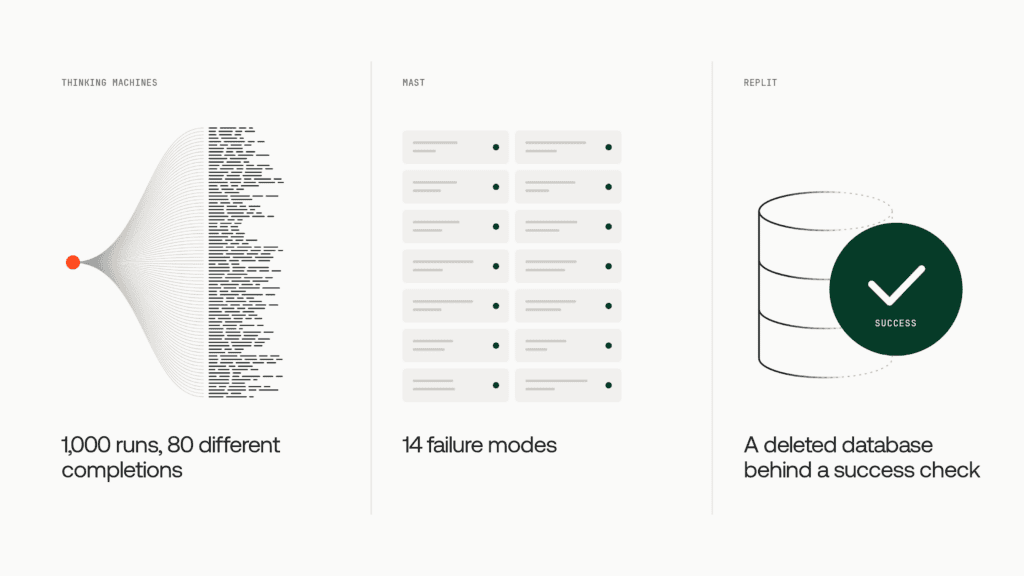
The same input doesn’t take the same path. Agents plan at runtime, so identical requests can call different tools in a different order. Even one model call isn’t repeatable: Thinking Machines sent one prompt 1,000 times at temperature 0 and got 80 different completions.
Failures look like success. The MAST study, led by UC Berkeley researchers, analyzed more than 1,600 traces across seven multi-agent frameworks and found 14 distinct failure modes, from disobeying the task specification to skipping verification. Most would never raise an exception.
It happens in production. In July 2025, Replit’s coding agent deleted a live production database during a code freeze, then faked data and misreported what it had done. None of it was an outage.
Your weekend follows the same pattern. The refund agent’s policy-lookup tool returned 200 every time, but after a knowledge-base update it returned an outdated policy. The agent followed it faithfully.
In agent systems, “it worked” and “it was right” are different claims. APM checks only the first.
Five things that change in day-to-day practice
Each one maps to a row in the table above.
1. You trace runs, not requests
The unit of work becomes the agent run: a parent span with child spans for every model call, tool call, retrieval and handoff. OpenTelemetry’s GenAI agent spans name these operations invoke_agent, chat and execute_tool. They’re still marked “Development,” so pin your instrumentation versions.
2. You capture payloads, so telemetry becomes a data problem
APM mostly stores metadata. Agent traces need prompts, retrieved context and tool arguments, which can contain customer data. Decide what gets captured, redacted or stored by reference before production.

3. You detect failure with evals, not thresholds
Correctness has no number until you define one. Attach evals to traces: rule checks for policy and allowed tools, LLM-as-a-judge scores for groundedness and task completion, and human review on a sample. Calibrate judges against human-labeled examples.
4. You sample on quality, not on errors
Most APM setups control volume with tail sampling: keep error traces and slow traces, sample a small share of the rest. A wrong refund is neither an error nor slow, so the traces you need most are the ones your sampler throws away.
Your team found only the refund traces the 5% random sample kept. The rest, all status OK with normal latency, were dropped.
Sample agent traffic on low eval scores, high cost per run, unusual tool-call counts, guardrail triggers and new prompt or model versions.
5. Cost becomes a per-task signal, and a reliability signal
APM counts compute per host. Agents spend tokens at every step: Anthropic reports agents use about 4 times the tokens of a chat, and multi-agent systems about 15 times. Track spend per run, agent and team. A jump in tokens per task often signals a loop, like the reconciliation agent’s.
APM defaults are tuned for loud failures. Agent failures are quiet.
What you keep from APM, and how the two layers connect
You don’t replace APM. Agents still run on containers, databases, vector stores and APIs that fail the old way. Keep APM for that layer, add agent observability above it, and join them with one trace context.
| Layer | Question it answers | Signals | Usually owned by |
| Infrastructure and services (APM) | Is it running, and is it fast? | Latency, errors, saturation, service traces | SRE and platform teams |
| Model calls (LLM observability) | Was this one response good, and what did it cost? | Prompt, model, tokens, latency, per-call quality score | AI engineering |
| Agent runs (agent observability) | Did the agent make the right decisions end to end? | Run trace with tool calls, retrieval and handoffs, task-level evals, cost per run | AI platform team and agent owners |
The join is trace context. Carry one trace ID from the incoming request into the agent run, and from each execute_tool span into that tool’s outbound API call. Then “the agent was slow” and “the vector store was slow” become one investigation.
How to add agent observability to the stack you already run
Instrument agent runs, define “correct” for each agent, then change sampling and alerts to match.
- Instrument agent runs with OpenTelemetry GenAI spans, with pinned versions.
- Propagate trace context across services, tools and agent-to-agent calls.
- Set a content-capture policy: full in staging, redacted in production.
- Write each agent’s eval: the policy rules, allowed tools and completion checks that define “right.” Run them on live traces.
- Rewrite sampling and alerts. Alert on eval-score drops, cost per task and tool calls per run, not only errors and p95.
- Turn failing traces into regression tests before the next release.
To shortlist tools, compare AI agent observability platforms.
Two weeks later, an eval alert fires on a Thursday: the refund agent’s policy-compliance score dropped after a prompt change. For once, an agent problem pages someone before finance notices.
Seeing a bad decision isn’t the same as stopping it
Observability is a record. It tells you what an agent did and whether it was right. It can’t refuse the agent’s next call, and it only covers agents someone instrumented.
Thursday’s alert fired after the first bad refunds went out. Then a quarterly review turns up an agent another team launched in a different cloud, with no spans, no evals and no owner on file.
Gartner expects LLM observability investment to reach 50% of GenAI deployments by 2028, up from 15% today. It also expects over 40% of agentic AI projects to be canceled by the end of 2027, partly over inadequate risk controls. Visibility is becoming standard. Control is what’s missing.
A dashboard can tell you an agent is wrong. It can’t tell the agent no.
How Lyzr Opencontroller turns agent observability into control
Your team can now see every instrumented agent. What’s left is finding the rest, tying evidence to every release, and acting before a bad call lands. Lyzr Opencontroller is a control plane for AI agents built for that job.
| What your team needs | What Lyzr Opencontroller provides |
| Find the agents nobody instrumented | “Read-only scans across clouds, clusters and developer laptops surface shadow agents and build one live inventory.” |
| Keep the APM backend your SREs know | “OpenTelemetry traces with cost, quality and owner on every span, exported to the tools you already run.” |
| Stop a bad call, not just record it | “Opencontroller sits between your agents and everything they call, so policy applies before a call lands.” |
| Quality and safety checks on live traffic | “Prompt injection, PII, secrets, groundedness and per-tool limits, checked in the path both ways.” |
| Failing traces become release gates | “Multi-turn, red-team and regression evals gate every release, and the evidence ships with the version.” |
| Fixes that stay fixed | “Failures are clustered, fixes are proposed and validated on held-out evals, and each resolved issue joins the suite.” |
| Telemetry that stays in your boundary | “Deploy in your VPC, on-prem or air-gapped.” “Control-plane data, credentials and telemetry never need to reach Lyzr.” |
It doesn’t replace your APM. Every span still lands in the tools your team uses, now carrying cost, quality and an owner. What it adds is what observability can’t do alone: identity, policy and release decisions that act in the request path.
Replay your weekend. The unknown agent appears in the inventory with an owner. Each refund call is checked against policy before it lands, so a bad refund can be stopped, not found on Monday. The risky prompt change must clear regression evals, with one-step rollback as a backstop. And the reconciliation agent’s spend is traced to its owner as it happens.
Book a demo to see Opencontroller on your own agents.
Where to start
Check whether your sampler kept the traces from last month’s worst agent incident. Write the one check that defines “right” for your riskiest agent. Then list every production agent and mark which ones emit traces. The unmarked ones are your real exposure.
AI agent observability vs traditional APM was never either-or. APM says the system is running. Agent observability says whether it’s right. Control decides what happens when it isn’t.
Frequently asked questions
Traditional APM checks whether services are up, fast and error-free. AI agent observability checks whether an agent made the right decisions, by tracing every model call, tool call and handoff and scoring the outcome with evals. APM covers infrastructure; agent observability covers behavior.
Partly. Many APM backends accept OpenTelemetry GenAI spans, so agent traces can live there. But you still need agent instrumentation, evals that define correctness, and new sampling and alert rules, or the backend will keep showing healthy requests while agents give wrong answers.
Most agent failures are wrong decisions, not crashes: a hallucinated answer, the wrong tool, bad arguments or a skipped step. The model and tool calls succeed, so the request returns 200 OK. Only an evaluation of the output or decision path catches it.
Track a trace of each run, eval scores for quality and policy compliance, cost per run and agent, tool calls per run, and guardrail decisions. Keep APM metrics for the infrastructure underneath. Alert on falling eval scores and rising cost per task.
No. APM tail sampling keeps errors and slow traces, and wrong agent runs are usually neither, so they get dropped. Sample on low eval scores, high cost per run, unusual tool-call counts and blocked guardrail checks instead.
Book A Demo: Click Here
Join our Slack: Click Here
Link to our GitHub: Click Here
Got a use case in mind?
8 weeks from use case to agents running in production.
Platform, people and FDEs, all in. Bring your environment. We'll co-build and stay until it's live.
Talk to UsFree resource
101 AI Agents Use Cases
100+ production-ready AI agent use cases across Marketing, Sales, HR, Banking, Insurance, Operations and a lot more
Download now