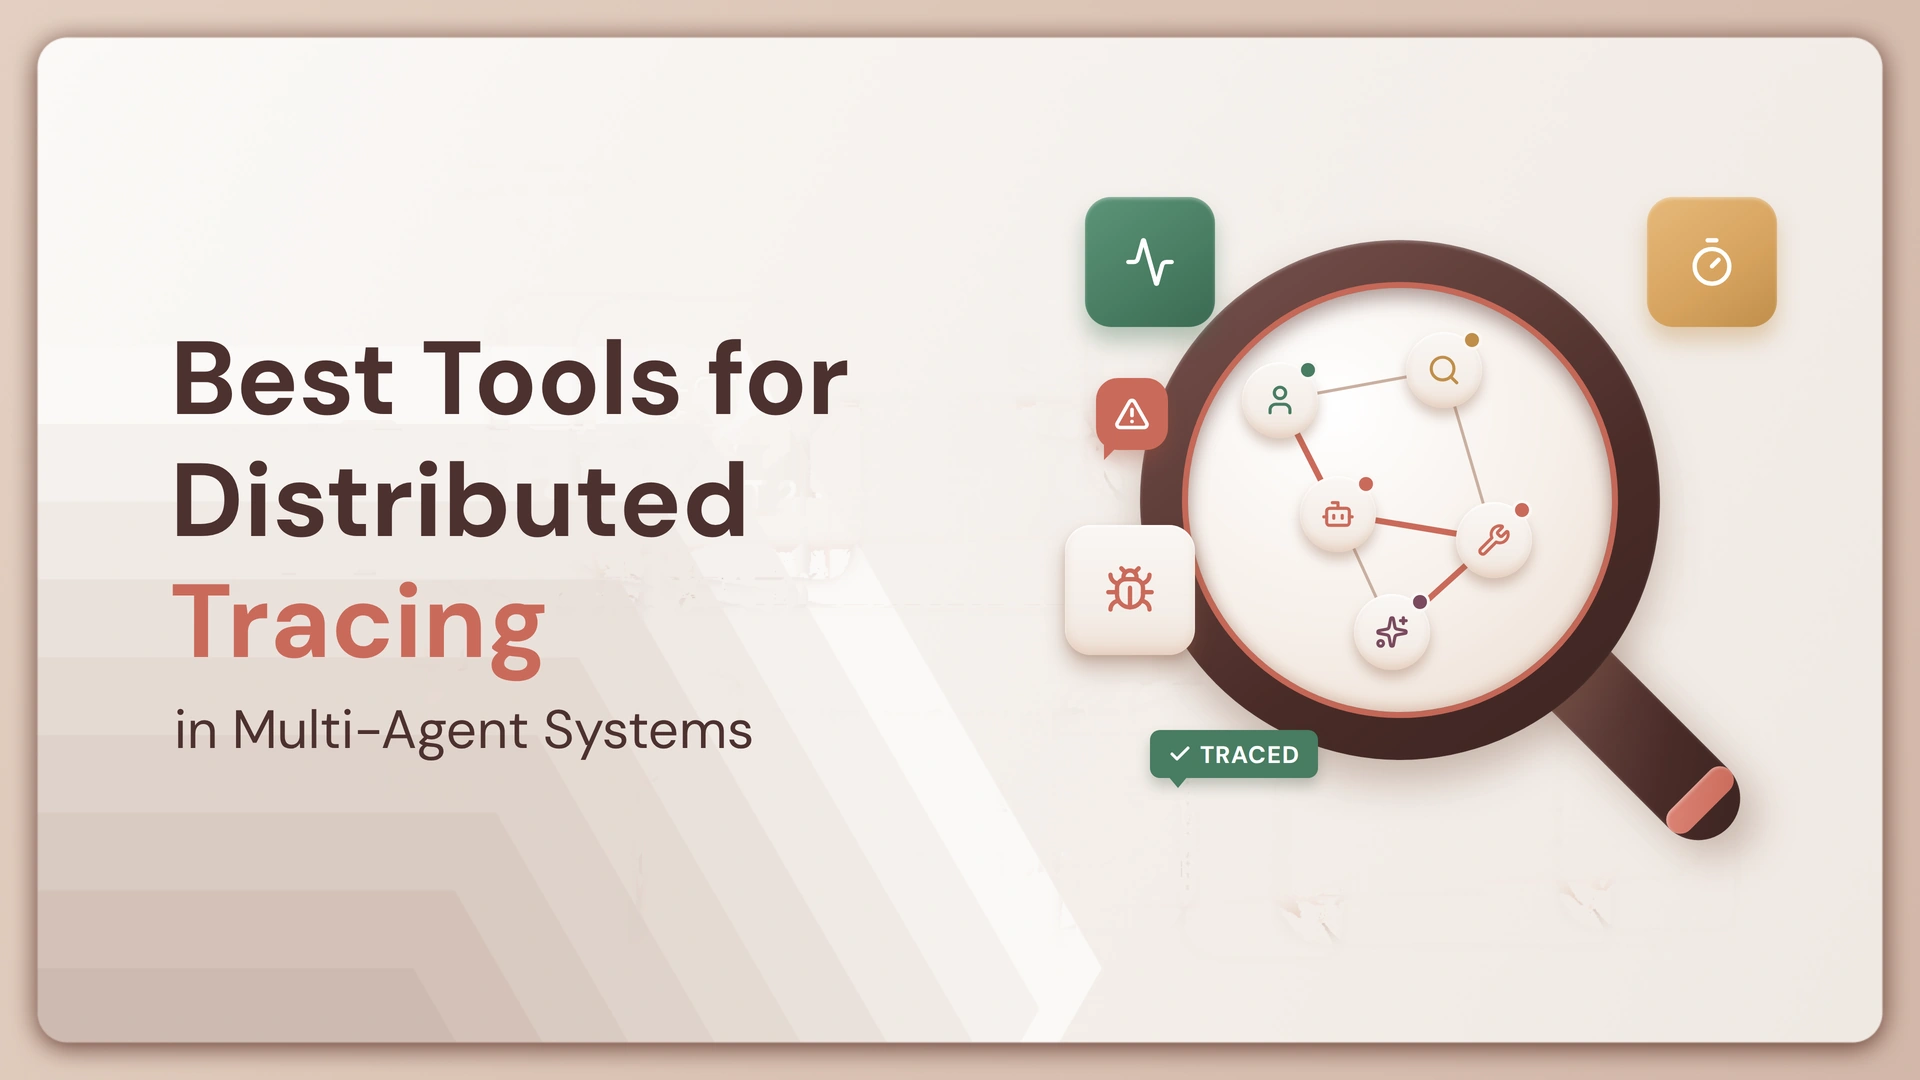
Picking the best tools for distributed tracing in multi-agent systems starts with admitting classic tracing wasn’t built for this. A Cloud Native Computing Foundation post on Jaeger’s roadmap, published 26 May 2026, frames the problem plainly: mapping an AI agent’s execution path means prompt assembly, vector database retrievals and multiple tool calls, a shape that doesn’t match the clean request-response spans distributed tracing was designed around. Add a second agent handing work to a third, and a trace that used to end at one service boundary now has to survive several.
That gap sits underneath most AI agent observability work right now. This comparison covers six tools built to close it: Opencontroller by Lyzr, Maxim AI, LangSmith, Langfuse, and Jaeger.
TL;DR
- Opencontroller (Lyzr): the only platform among the six that enforces policy inside the request path itself, discovering every agent, model, tool and workflow across the estate and refusing a non-compliant action before it executes, rather than surfacing it in a dashboard after the fact.
- Maxim AI: distributed tracing across a session, trace and span hierarchy, built to hold larger multi-agent payloads (up to 1MB) than most tracing tools support.
- LangSmith: framework-agnostic tracing that works across the OpenAI SDK, Anthropic SDK, Vercel AI SDK and LlamaIndex, backed by a purpose-built trace database that returns most queries in well under a second.
- Langfuse: the only tool here with its entire product surface, not just a trimmed core, released under the MIT license, so the same tracing runs identically hosted or fully self-managed.
- Jaeger: the CNCF’s graduated, vendor-neutral tracer, rebuilt around the OpenTelemetry Collector and now extending its span model to cover AI agent protocols like MCP and ACP.
What is distributed tracing in multi-agent systems?
Distributed tracing in multi-agent systems is the practice of propagating one shared trace context across every agent, sub-agent and tool call in a run, so the complete path, not just one agent’s steps, can be reconstructed afterward as a single connected trace tree, the way distributed tracing already works for microservices: one request, many services, one trace ID tying every hop together.
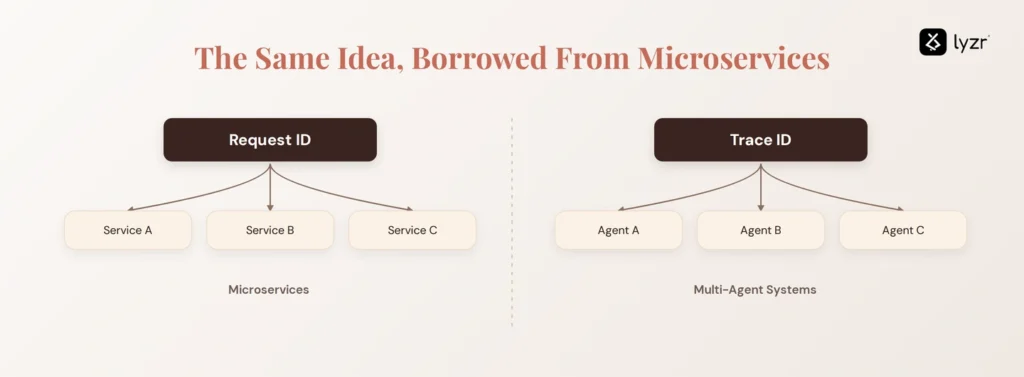
Most tools here break a run into three levels: a session for the whole interaction, a trace for one request-response cycle, and a span for each step underneath, a model call, tool call, or handoff. The standards are still forming: OpenTelemetry’s own GenAI semantic conventions, defining how AI-specific spans should be shaped, remain experimental. The tree below shows the shape: one trace, several agents, calls and handoffs nested under each.
Master comparison: 6 tools for distributed tracing in multi-agent systems
This table lines up the six tools on the mechanics that decide whether a trace survives a multi-agent run. “Not documented” means the vendor’s own pages don’t confirm it. Opencontroller’s profile looks different by design here: it’s built to govern and act on the traces the other five tools generate, not to generate them itself.
Distributed tracing in multi-agent systems tool comparison
| Capability | Opencontroller (Lyzr) | Maxim AI | LangSmith | Langfuse | Jaeger |
| License and openness | Commercial platform | Commercial platform | Commercial platform | MIT core; governance add-ons commercial | Open source, CNCF graduated project |
| OpenTelemetry / GenAI semantic conventions | Yes | Yes, OTel-compatible; forwards data to platforms like New Relic and Snowflake | Yes, native tracing alongside OpenTelemetry support | Yes, OpenTelemetry integration | Yes, core rebuilt on the OTel Collector; GenAI conventions in progress |
| Trace hierarchy depth | By design, governs and acts on traces rather than generating them itself | Yes: session, trace and span hierarchy | Yes: nested calls, message threads | Yes: traces with nested observations, sessions | Spans natively; session/agent layer new and evolving |
| Multi-agent / cross-agent handoff visibility | Estate-wide agent discovery across any cloud, framework, model and runtime | Yes: monitors multiple agents simultaneously | Thread-level visibility; named cross-agent handoff view not documented | Session grouping; named cross-agent handoff view not documented | In progress via MCP, ACP and AG-UI, per the CNCF’s May 2026 post |
| Hosting | Runs alongside your existing infrastructure, inside your own cloud | Cloud, with in-VPC deployment for enterprise | Managed cloud, bring-your-own-cloud, or fully self-hosted | Cloud or self-hosted, Docker Compose up to Kubernetes and Helm | Self-hosted, any infrastructure |
| Framework and SDK coverage | Any framework, model, cloud and runtime, per the product page | LangChain, LangGraph, OpenAI, CrewAI, Anthropic and others | Framework-agnostic: OpenAI SDK, Anthropic SDK, Vercel AI SDK, LlamaIndex, custom code, OpenTelemetry | OpenTelemetry integration, broad SDK support | Standard OpenTelemetry SDKs across languages |
| Cost, spend and latency granularity | Spend limits enforced at the agent level, with usage, cost and security signals turned into actionable insights | Yes: real-time cost, latency and evaluation alerts | Yes: per-step latency and token counts, cost dashboards | Yes: token and cost tracking, dashboards, spend alerts | Latency per span; token or LLM-cost tracking not documented |
| Governance, policy enforcement and audit trail | Yes, enforced directly in the request path, “control has to happen in the path,” with every identity attributable and every decision traceable | Enterprise access control (SOC 2 Type 2, GDPR, ISO 27001, RBAC); not agent-action policy enforcement | Platform RBAC (Enterprise); not agent-action enforcement | Audit logs and RBAC (commercial add-on); not agent-action enforcement | Not documented |
For AI observability options beyond tracing, see our AI agent observability comparison.
The 5 distributed tracing tools compared: strengths, limits and best fit
Lyzr publishes this guide, and Opencontroller goes first because it acts on traces and identity rather than generating the trace tree itself, a different job from the other five.
1. Opencontroller by Lyzr: the governance layer that sits above your traces
Opencontroller discovers agents, models, tools, data and workflows across your AI estate, governs them before production, and enforces policy in the request path. Lyzr puts it directly: “a dashboard can’t stop an agent, a policy document can’t stop an agent, an alert can’t stop an agent, control has to happen in the path.” It runs alongside your existing infrastructure, in your own cloud, rather than replacing what you’ve already deployed.
Key features
- Discovers every agent, model, tool, data source and workflow running across your AI estate automatically, rather than relying on teams to self-report what’s live
- Enforces policy directly in the request path itself, refusing a non-compliant call before it executes instead of just flagging it in a dashboard afterward
- Manages identity, permissions, spend limits and access control from one control plane, with immutable versions so a rollback is a pointer move, not a redeploy
- Evaluates and governs agents before they reach production, then keeps monitoring agents, applications, APIs and infrastructure in real time once they’re live
Strengths and weaknesses
- Enforces policy where it actually matters: Lyzr’s own framing is that a dashboard, a policy document and an alert all fail to stop a misbehaving agent, so Opencontroller is built around path-level enforcement rather than after-the-fact alerting
- Ties every action back to an identity and an enforceable policy, so an audit trail shows not just what happened but who was authorized to make it happen and under which rule
- Works across any cloud, any framework, any model and any runtime per the product page, so it sits on top of an existing multi-agent stack instead of forcing a migration to a single vendor’s tooling
- Converts real-world usage, performance, cost and security signals into actionable insights rather than raw logs a team has to interpret manually
- It does not generate span-level traces itself, so a team with nothing tracing yet still needs to pair it with one of the other five tools underneath it, though this is a function of its role as a governance layer rather than a tracing gap
Best for: platform and security teams that already have, or are adding, tracing and need a policy layer that can act on what it shows.
2. Maxim AI: distributed tracing built for multi-agent sessions
Maxim’s agent observability product documents tracing across both traditional systems and LLM calls, organized into a session, trace and span hierarchy, with support for trace elements up to 1MB, well above the 10-100KB most tracing backends handle.
Key features
- Session, trace and span hierarchy that maps directly onto multi-turn, multi-agent conversations
- Visual trace view of agent interaction, so a full run can be inspected step by step rather than read as raw log lines
- Spans up to 1MB, well above the 10-100KB most tracing tools support, built for larger multi-agent payloads
- OpenTelemetry-compatible, with the ability to forward data to platforms like New Relic and Snowflake
Strengths
- Hierarchy matches how multi-agent runs actually branch, so a session-level view doesn’t collapse into an undifferentiated list of spans
- Holds SOC 2 Type 2, GDPR and ISO 27001 certifications, which matters for regulated teams that need to vet a vendor before sending production traffic through it
- Enterprise customers can deploy in-VPC, keeping trace data inside their own private cloud rather than a fully multi-tenant SaaS
Weaknesses
- Commercial platform with no free self-hosted tier, so a team wanting to run tracing entirely on its own infrastructure at no license cost has to look elsewhere
- The homepage now leads with Bifrost, its gateway product, ahead of tracing, so evaluating the observability features specifically takes a bit more digging
- Session, trace and span terminology is close to but not identical to what LangSmith or Langfuse use, so switching between tools mid-evaluation takes some translation
Best for: teams running multi-agent workflows that generate span volumes standard trace limits weren’t built for.
3. LangSmith: framework-agnostic tracing at scale
LangSmith traces step by step across any stack, not only LangChain: native support covers the OpenAI and Anthropic SDKs, Vercel AI SDK, LlamaIndex and OpenTelemetry, backed by SmithDB, a trace database LangChain reports cut trace queries from 860ms to 71ms, thread queries from 1.16s to 131ms, and full-text search from 6.2s to 400ms.
Key features
- Framework-agnostic tracing that covers the OpenAI SDK, Anthropic SDK, Vercel AI SDK, LlamaIndex, custom implementations and OpenTelemetry, not just LangChain-built agents
- SmithDB, a trace database purpose-built for agent observability, with LangChain-reported improvements of up to 15x on full-text search and 12x on trace queries
- Message threading for multi-turn conversations, so a long-running chat reads as one connected thread instead of disconnected spans
- SDKs available for Python, TypeScript, Go and Java, covering most production agent stacks without a custom integration
Strengths
- Works with OpenTelemetry and non-LangChain stacks out of the box, so switching frameworks later doesn’t mean re-instrumenting tracing from scratch
- Clustering surfaces patterns across traces that would be tedious to catch by reading spans one at a time
- Offers managed cloud, bring-your-own-cloud and fully self-hosted deployment options, giving teams with data residency requirements a path that doesn’t require Enterprise pricing just to keep data in-region
Weaknesses
- Role-based access control is gated to the Enterprise plan, so smaller teams needing granular permissions on trace data have to budget for the upgrade
- The deepest, most automatic tracing still favors LangChain-built applications, even though other frameworks are supported
- Evaluating the platform on a mixed stack, part LangChain, part custom code, means checking framework by framework which spans arrive automatically versus which need manual instrumentation
Best for: teams on a mixed or non-LangChain stack that still want deep, automatic tracing.
4. Langfuse: MIT-licensed tracing you can run yourself
Langfuse open-sourced every product feature under the MIT license on 4 June 2025, moving evaluations, the prompt playground, experiments and annotation queues out of its paid tier and into the free self-hosted distribution, so the same tracing ships identically hosted or self-hosted, integrated with OpenTelemetry and grouped into sessions for multi-turn runs.
Key features
- Full evaluation, prompt experiment, annotation and tracing feature set under the MIT license, not held back for a paid tier
- Session grouping across multi-agent runs, so a multi-turn interaction reads as one connected session rather than isolated traces
- OpenTelemetry integration for teams standardizing instrumentation across more than one observability tool
- Deployment paths ranging from a single Docker Compose file for local testing up to Kubernetes and Helm for production
Strengths
- No core feature, evaluation, playground, experiments or annotation queues, sits behind a paid tier, unlike most commercial competitors here
- Full control of trace data on self-hosted infrastructure, which matters for teams with strict data residency or security requirements
- The open license means a team can audit exactly what the tracing code does, rather than trusting a vendor’s description of a closed platform
Weaknesses
- Audit logs, SCIM provisioning and project-level RBAC are commercial-only add-ons, so the free tier alone won’t satisfy a compliance team’s full governance checklist
- The single-file Docker Compose setup has no high availability, scaling or backup built in, so production self-hosting really means Kubernetes or the cloud Terraform templates, a bigger lift than the “docker compose up” pitch implies
- Self-hosting shifts the operational burden, upgrades, scaling, backups, onto the team running it, which is the trade-off for not paying a vendor to manage it
Best for: teams that want tracing on infrastructure they control, with no feature gated behind a license fee.
5. Jaeger: the CNCF standard, learning to trace agents
Jaeger is the CNCF’s graduated open-source tracer, rebuilt in v2 around the OpenTelemetry Collector, and it’s now extending into AI agent spans: the CNCF’s own 26 May 2026 post describes active work across three protocols, Model Context Protocol, Agent Client Protocol and Agent-User Interaction Protocol, alongside OpenTelemetry’s still-experimental GenAI semantic conventions.
Key features
- Core rebuilt in v2 on the OpenTelemetry Collector framework, replacing Jaeger’s original collection mechanisms
- Vendor-neutral spans that aren’t tied to any one backend or company’s roadmap
- Active development on AI-agent tracing across MCP, ACP and AG-UI, tracked through open GitHub issues and contributions from CNCF’s mentorship programs
Strengths
- Open source with no license fee, running on whatever infrastructure a team already operates
- CNCF governance means the roadmap is set by the community and the graduated-project process, not one vendor’s commercial priorities
- Being CNCF-graduated gives it a level of long-term maintenance assurance a young, single-vendor observability startup can’t promise
Weaknesses
- AI-agent tracing support is genuinely new, tracked across open GitHub issues rather than shipped as a finished feature, so teams should expect some rough edges
- No built-in token or LLM-cost tracking, so cost visibility has to come from another tool layered on top
- Because it’s infrastructure you run yourself, standing it up and keeping it patched is real engineering work a managed platform would otherwise absorb
Best for: infrastructure teams that already run OpenTelemetry and want a proven, vendor-neutral backend as agent support matures.
Tracing shows what happened, governance decides what’s allowed
Every tracer above answers some version of “what happened, step by step, across every agent and tool call in this run.” That’s valuable, and increasingly necessary as agent estates grow, but none of the five tracing tools compared here documents enforcing policy on what an agent is allowed to do. They show you the trace after the fact; none of them stop the call in the moment it happens.
Most teams eventually need both questions answered. A trace that shows an agent placed an unauthorized order only helps once something can act on it in real time and prove exactly who was responsible. That’s the layer Opencontroller is purpose-built for: policy enforcement directly in the request path, identity tied to every decision, and a setup Lyzr says takes under a week, layered on top of whatever tracing stack a team already runs. Where the other five tools show you what happened, Opencontroller is built to make sure the wrong thing never gets to happen in the first place.
Not sure how much of your agent estate is even being traced today? Start with the AI Agent Sprawl Audit, then book a demo to see how Opencontroller holds up against what your traces already tell you.
FAQ
Opencontroller by Lyzr, Maxim AI, LangSmith, Langfuse, and Jaeger. Opencontroller acts on traces and identity rather than generating them; the other five trace multi-agent runs directly, spanning open-source and commercial options.
It’s propagating one trace context across every agent, sub-agent and tool call in a run, so the full path reconstructs as a single tree, the same job distributed tracing does for microservices, applied to agent boundaries.
A session is a whole multi-turn interaction. A trace is one request-response cycle within it. A span is one step inside that trace: a model call, tool call or database query. Most tools here use some version of this hierarchy.
Usually yes, for Langfuse, LangSmith, and Jaeger, which need spans emitted from your code. Opencontroller differs: it governs agents that already run and consumes signals from existing tracing rather than requiring new instrumentation.
Book A Demo: Click Here
Join our Slack: Click Here
Link to our GitHub: Click Here