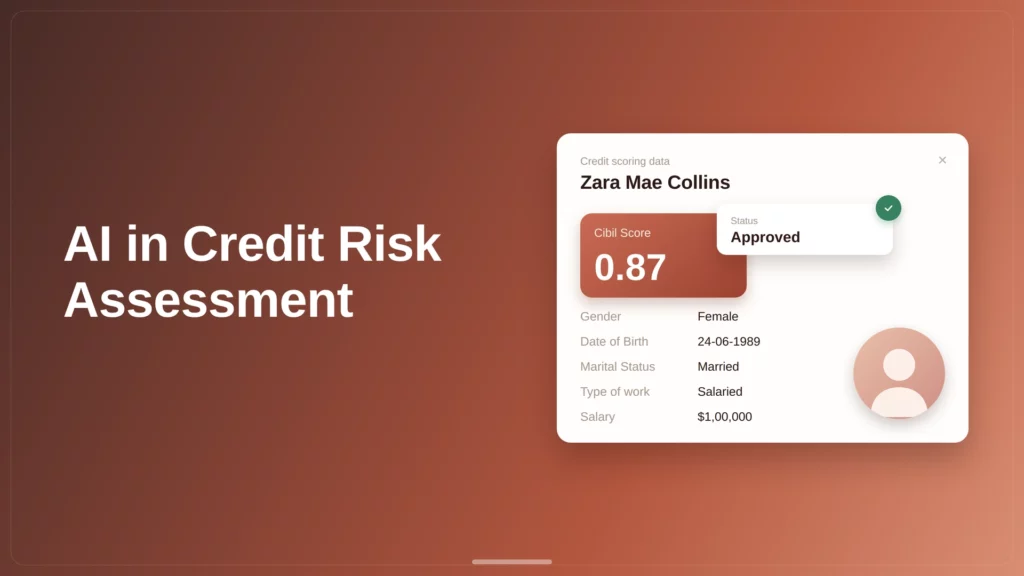
For investment teams, the quality of analysis often depends on how quickly raw financial data can be converted into a model-ready format.
Yet across private equity and M&A workflows, analysts continue to spend hours manually cleaning spreadsheets, reconciling categories, and wiring formulas before actual diligence can begin.
The private firm equity faced the same challenge. Each acquisition target arrived with financial data structured differently, creating significant manual effort before analysts could begin evaluating opportunities.
To eliminate this bottleneck, the firm partnered with Lyzr to build an AI-powered Financial Extractor that automates financial preparation while preserving the firm’s existing LBO modeling process.
Why Financial Due Diligence Often Starts With a Spreadsheet Problem?
Most acquisition targets don’t provide financial information in a standardized format.
A typical diligence package contains multiple Excel sheets spanning several years, with different naming conventions, inconsistent categorization, merged cells, subtotals, and varying chart-of-account structures. Before any valuation work can begin, analysts first need to transform this information into a format that aligns with their firm’s financial models.
The challenge isn’t gathering the data. The challenge is making that data usable.
Across private equity firms, this preparation process often includes:
- Consolidating financial data from multiple tabs
- Standardizing category names across periods
- Building historical financial views
- Mapping categories into modeling templates
- Creating formula dependencies that remain dynamic
- Validating outputs and formatting deliverables
While these activities are essential, they add little analytical value. They consume hours of analyst time while introducing opportunities for human error.
When Manual Financial Preparation Became a Bottleneck at the leading Equity Firm
This firm’s investment team reviews dozens of acquisition opportunities every year.
Each new diligence cycle began with a familiar process: receiving a client workbook containing multiple reporting periods and manually converting that information into the firm’s LBO template structure.
The process was highly dependent on analyst effort and institutional knowledge.
What analysts were spending time on
| Activity | Typical Effort |
| Reviewing financial tabs and workbook structure | 30–60 mins |
| Reconciling category names across periods | 1–2 hrs |
| Building consolidated historical views | 2–3 hrs |
| Mapping categories into the LBO template | 1–2 hrs |
| Creating formula dependencies | 1–2 hrs |
| Validation and formatting checks | 30–60 mins |
| Total effort per target | 6–10 hours |
The issue wasn’t simply time.
The workflow created several operational risks:
Key challenges
| Challenge | Impact |
| Inconsistent category naming across years | Required manual reconciliation |
| Spreadsheet formula dependencies | Increased risk of modeling errors |
| Corrected client files | Forced analysts to restart work |
| Institutional knowledge locked with senior team members | Limited scalability |
| Analyst-specific workflows | Inconsistent outputs across deals |
By the time preparation was complete, analysts had already spent most of a day on spreadsheet engineering rather than investment analysis.
Why the leading Equity Firm Needed More Than Another Data Extraction Tool
Many automation solutions focus on extracting data.
This firm’s requirement was different.
The firm already had established modeling conventions, reporting formats, review processes, and LBO templates. Replacing those systems would create more disruption than value.
Instead, the goal was to eliminate manual preparation while preserving everything analysts already trusted.
The ideal solution needed to:
- Work with any client workbook structure
- Preserve existing LBO templates
- Standardize financial categories automatically
- Generate formula-linked outputs
- Maintain analyst oversight
- Support repeatable and auditable workflows
Most importantly, the final deliverable needed to look and behave exactly as if an analyst had built it manually.
Building an AI-Powered Financial Extractor Around Existing LBO Workflows
Lyzr worked with the firm to develop a purpose-built Financial Extractor designed specifically for investment analysis workflows.

Rather than introducing a new modeling environment, the platform acts as an intelligence layer between raw client financials and the firm’s existing LBO model.
The outcome is simple:
Upload a client workbook. Download a model-ready version of the same workbook with consolidated and mapped financials already prepared.
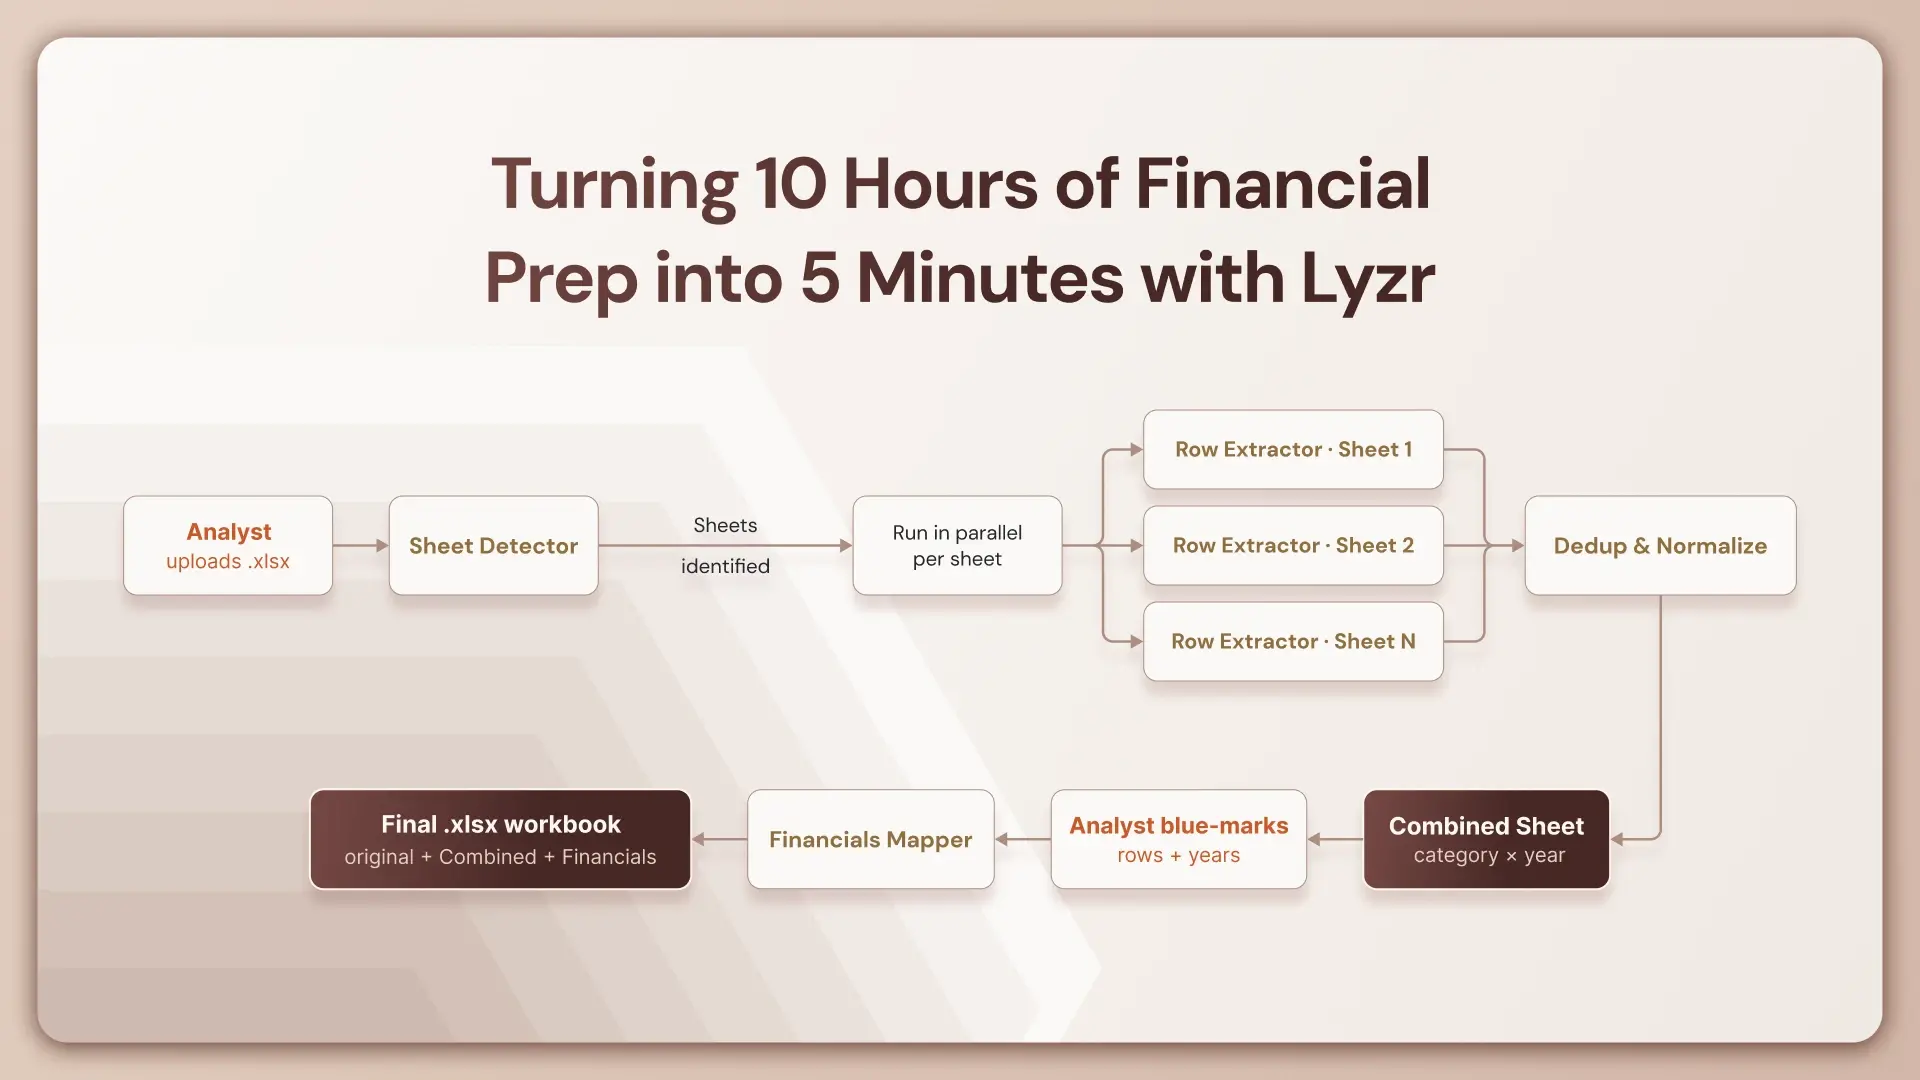
At the center of the solution is a multi-agent architecture that automates extraction, normalization, mapping, and workbook generation.
Core capabilities delivered
| Capability | Purpose |
| Financial extraction | Capture financial data regardless of workbook structure |
| Category normalization | Standardize labels across reporting periods |
| Financial mapping | Align extracted data with LBO model conventions |
| Workbook generation | Produce model-ready outputs with live formulas |
| Session persistence | Save analyst selections and progress |
| Formula automation | Remove manual spreadsheet wiring |
How the Workflow Moves From Raw Workbook to Model-Ready Output
Step 1: Upload and Analyze
Analysts upload a client workbook without making any modifications. The platform stores the file and initiates the processing workflow.

Step 2: Four Specialized AI Agents Process the Data
Instead of relying on a single extraction engine, the platform distributes responsibilities across multiple agents.
| Agent | Responsibility |
| Sheet Analyzer | Identifies relevant financial sheets |
| Row Extractor | Extracts categories, values, periods, and hierarchies |
| Normalization Agent | Standardizes naming inconsistencies across years |
| Combined Report Builder | Produces a consolidated financial matrix |
The result is a clean and normalized financial dataset ready for review.
Each agent run is persisted, with a SHA-based cache so the same file uploaded twice reuses the prior extraction.

Step 3: Blue-Marking for Analyst Review
The analyst reviews the consolidated output and selects the rows that should flow into the final model.

Selections are automatically persisted, allowing analysts to continue their work later without losing progress.
Step 4: Intelligent Financial Mapping
A dedicated Financial Mapper agent proposes how each extracted category should align with the firm’s LBO structure.


Analysts retain full control and can:
- Modify labels
- Change mappings
- Add rows
- Remove rows
- Regenerate recommendations
This keeps the analyst in control while dramatically reducing manual effort.
Step 5: Generate the Final Workbook
Upon approval, the platform creates a new workbook that:
- Preserves every original worksheet
- Adds a Combined (Extracted) sheet
- Adds a Financials sheet
- Generates live SUMPRODUCT formulas
- Applies firm-specific formatting conventions
- Opens correctly across Excel environments
The result is a model-ready workbook with no manual spreadsheet engineering required.
The Product Features Analysts Ended Up Using Every Day
While automation drove efficiency gains, several workflow enhancements played a critical role in adoption.
Features designed around analyst workflows
| Feature | Benefit |
| Blue-marking persistence | Resume work without repeating selections |
| Editable mappings | Maintain analyst control over outputs |
| Tick-to-save workflow | Ensure edits are captured before download |
| Preview-to-output parity | Eliminate export surprises |
| Automated formatting | Maintain consistency across deliverables |
| SHA-based caching | Reprocess corrected files in seconds |
These capabilities helped the platform fit naturally into existing diligence processes.
What Changed After Deployment
The impact was visible almost immediately.
Instead of spending hours preparing spreadsheets, analysts could begin reviewing financial performance and building investment theses within minutes.
Knowledge that previously lived inside the heads of senior team members became embedded into the workflow itself.
Processes became repeatable, auditable, and consistent across the organization.
Before and after
| Before | After |
| 6–10 hours of preparation | Under 5 minutes |
| Manual category reconciliation | Automated normalization |
| Formula wiring by analysts | Automated live formulas |
| Knowledge concentrated in individuals | Knowledge embedded into workflows |
| Rework for corrected files | Cached reprocessing |
| Variable analyst outputs | Standardized deliverables |
More Time for Analysis, Less Time for Spreadsheet Engineering
The biggest outcome wasn’t faster spreadsheets.
It was giving analysts their time back.
By automating extraction, normalization, mapping, and workbook generation, the equity firm converted one of the most repetitive stages of financial diligence into a repeatable workflow that runs in minutes.
Analysts can now focus on evaluating businesses, validating assumptions, and uncovering investment opportunities instead of manually preparing financial models.
Book A Demo: Click Here
Join our Slack: Click Here
Link to our GitHub: Click Here