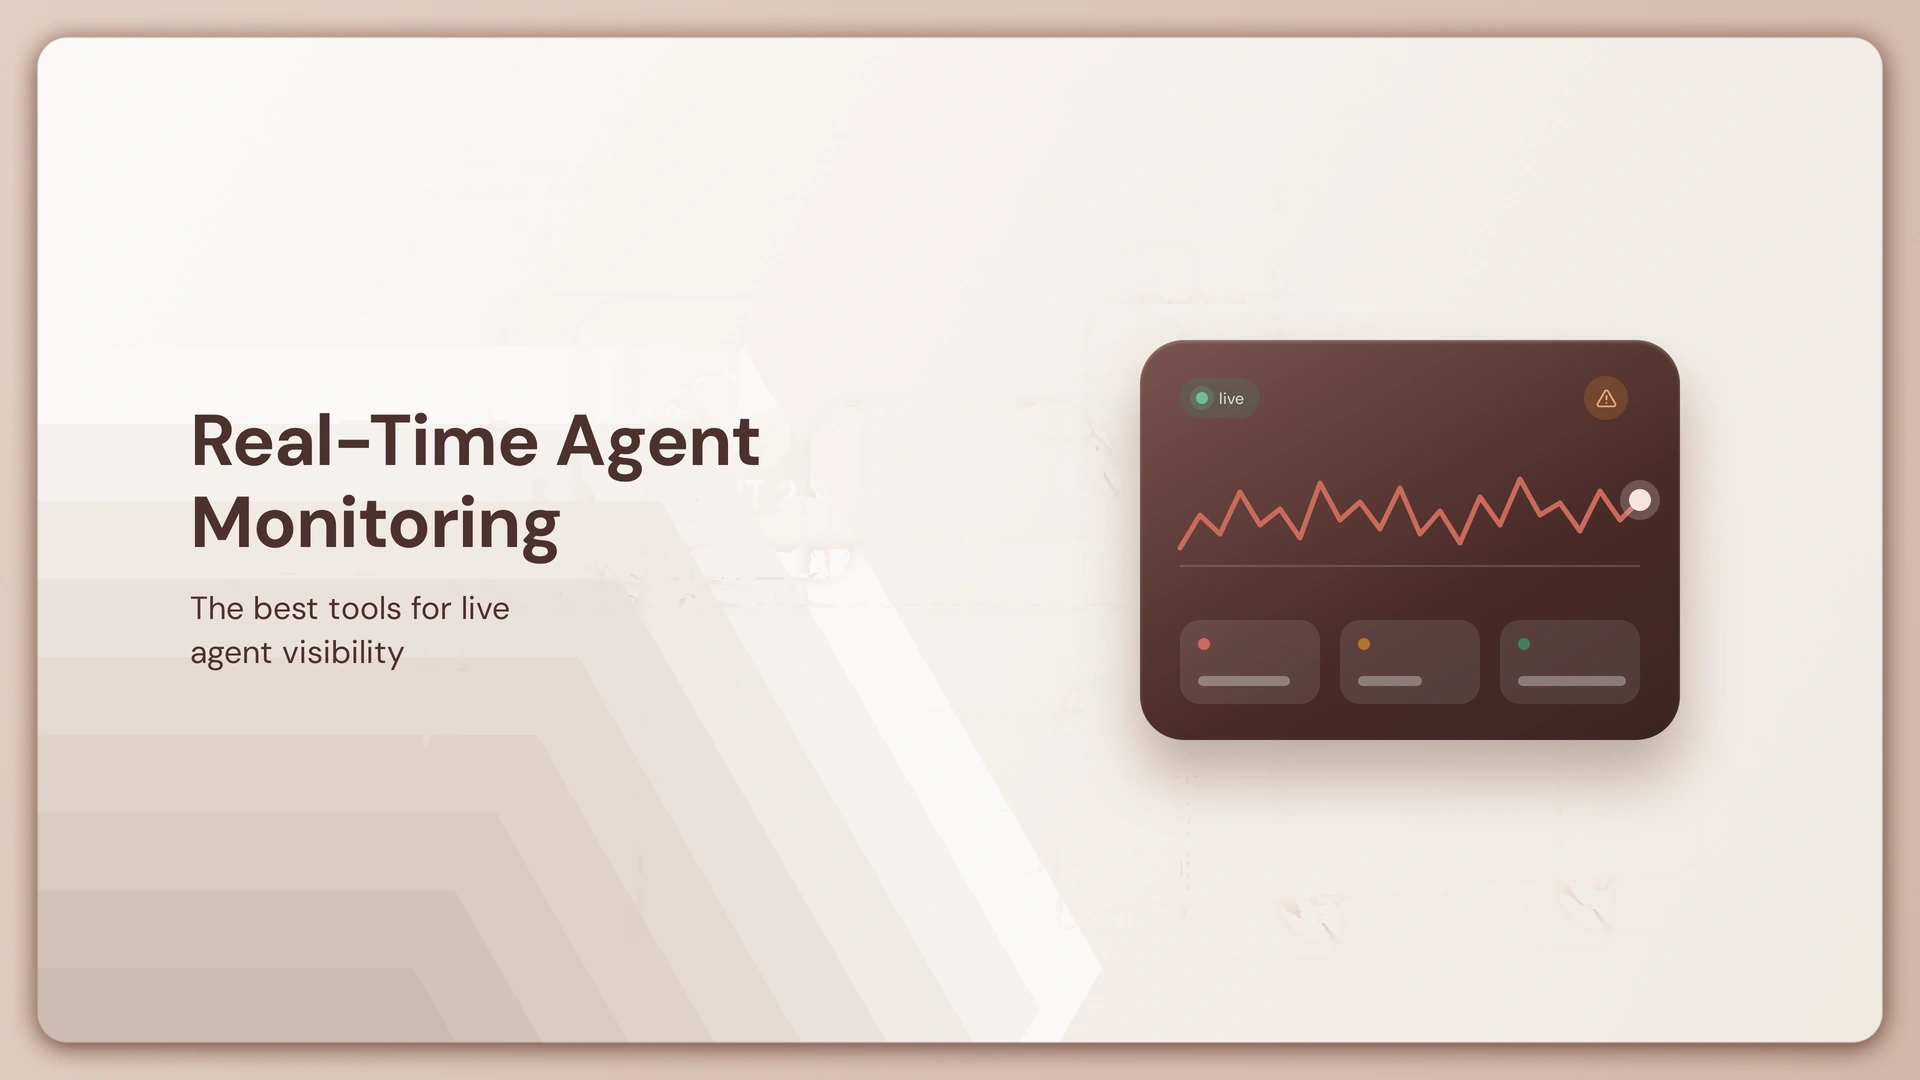
The dashboard is green. The API returned 200, latency is normal, and no infrastructure alert fired. Meanwhile, the agent chose the wrong tool, looped four times and burned through its token budget on one request. Traditional monitoring can’t see any of that.
The best tools for real-time AI agent monitoring capture the entire trajectory: every step, model call and tool call, plus cost, latency, output quality and alerts when behavior drifts. The gap is wide. LangChain’s State of Agent Engineering survey found 89% of respondents had agent observability, but only 37% ran online evaluations.
Here are seven platforms compared.
TL;DR
- Lyzr Opencontroller: Best when monitoring must connect to identity, policy and enforcement.
- LangSmith: Best for LangChain/LangGraph teams wanting tracing, monitoring and evaluation in one workflow.
- Braintrust: Best when production traces must feed evaluation and regression tests.
- Langfuse or Arize Phoenix: Best open-source options for self-hosting and telemetry ownership.
- Datadog: Best for enterprises already running infrastructure observability there.
- Galileo AI: Best for continuous evaluation with runtime guardrails.
What Is Real-Time AI Agent Monitoring?
Real-time AI agent monitoring is continuous observation of production agents: runs, individual steps, model calls, tool calls, latency, token cost, errors, output quality, safety signals and unusual behavior, with alerts when something drifts.
Traditional application monitoring asks whether the service is healthy. Agent monitoring also asks what the agent did and whether that was appropriate. It extends AI agent observability with live scoring and alerting, and it is the practice behind production monitoring in agent platforms.
How the Tools Compare
| Tool | Real-time traces | Agent/tool tracing | Online evals | Cost/latency | Open source/self-host | Alerts | Governance/control |
| Lyzr Opencontroller | ✓ | ✓ | ✓ | ✓ | Partial | ✓ | ✓ |
| LangSmith | ✓ | ✓ | ✓ | ✓ | Partial | ✓ | No |
| Braintrust | ✓ | ✓ | ✓ | ✓ | Partial | ✓ | No |
| Arize Phoenix | ✓ | ✓ | Partial | ✓ | ✓ | Partial | No |
| Langfuse | ✓ | ✓ | ✓ | ✓ | ✓ | Partial | No |
| Datadog | ✓ | ✓ | ✓ | ✓ | No | ✓ | No |
| Galileo AI | ✓ | ✓ | ✓ | ✓ | Partial | ✓ | Partial |
Partial means a higher tier or companion product is required, such as Langfuse alerts (Cloud only) or Phoenix alerts (Arize AX). Helicone is omitted: Mintlify acquired it in March 2026 and it now runs in maintenance mode.
The 7 Best Tools for Real-Time AI Agent Monitoring
1. Lyzr Opencontroller
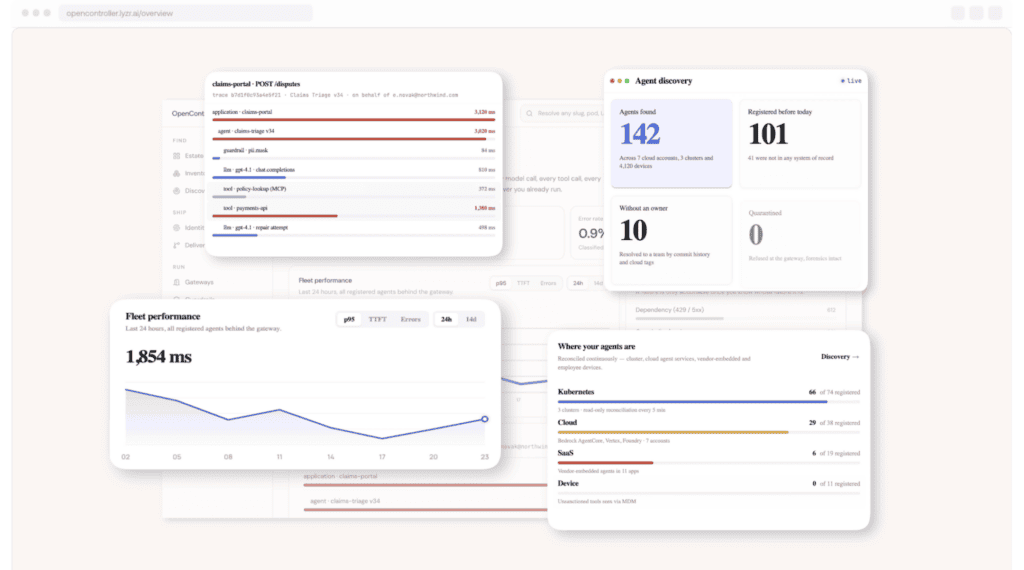
Lyzr Opencontroller sits one layer beyond monitoring. It shows agents, identities, activity and evaluation, then adds policy and enforcement so budgets and rules can refuse a call rather than merely alert. That separates it from platforms built to record what happened. It works as an AI control plane for AI agent governance across frameworks and clouds.
Key features
- Agent registry and identity
- Runtime activity observability
- Evaluation and promotion gates
- Policy and enforcement
Strengths
- Connects observability to governance
- Built for mixed agent estates
- Controls beyond passive monitoring
Weaknesses
- Broader than tracing-only needs
- Not open-source observability
- May complement existing tools
Best for: Enterprises past “can we see our agents?” who need monitoring tied to identity, policy, evaluation and runtime governance.
2. LangSmith

LangSmith began as a LangChain debugger and now positions itself as a framework-agnostic agent engineering platform, linking production traces to evaluation.
Key features
- Agent and tool tracing
- Real-time monitoring
- Online evaluations
- Cost, latency and error tracking
Strengths
- Strong agent debugging
- Observability tied to evals
- Deep LangGraph ecosystem
Weaknesses
- Awkward for fully self-hosted stacks
- Best workflows sit inside LangChain
- Heavy for basic tracing
Best for: Teams on LangChain/LangGraph wanting monitoring and evaluation together.
3. Braintrust

Braintrust lets teams inspect agent traces and tool calls live, score production traffic, and alert before quality drops reach users.
Key features
- Real-time agent traces
- Live quality scoring
- Cost and latency monitoring
- Traces converted to eval datasets
Strengths
- Tight observe-to-evaluate loop
- Production-to-regression workflow
- Broad integrations
Weaknesses
- Evaluation-heavy for telemetry-only needs
- Less infrastructure-native than Datadog
- Self-hosting needs Enterprise
Best for: AI engineering teams tying production monitoring to regression testing.
4. Arize Phoenix

Phoenix is the open-source anchor here. Built on OpenTelemetry and OpenInference, it combines tracing, evaluation and debugging. Automated alerting sits in the paid Arize AX platform.
Key features
- Open-source tracing
- OpenTelemetry/OpenInference
- Agent evaluation
- Self-hosting
Strengths
- Framework-agnostic
- Strong tracing plus evals
- Free to run
Weaknesses
- You operate the deployment
- Elastic License 2.0, not OSI open source
- Alerting requires AX
Best for: Engineers wanting standards-based observability and control over where telemetry lives.
5. Langfuse

Langfuse is an open-source (MIT) platform for tracing, datasets, experiments and evaluation, now part of ClickHouse. Its maintainers say the roadmap and self-hosting commitment are unchanged.
Key features
- Self-hostable agent traces
- Token, cost and latency monitoring
- Evaluation
- Cloud alerts
Strengths
- Strong open-source choice
- Broad framework support
- Telemetry ownership
Weaknesses
- Self-hosting adds operational load
- Alerts are Cloud-only
- Narrower governance
Best for: Teams wanting flexible, open-source observability across models and frameworks.
6. Datadog Agent Observability

Datadog places agent monitoring inside its existing observability platform: traces for dynamic agent workflows, tool calls, latency, errors and online evaluations beside application and infrastructure telemetry.
Key features
- Agent traces
- LLM and tool workflow monitoring
- Infrastructure correlation
- Dashboards and alerts
Strengths
- One pane for existing Datadog users
- Strong infrastructure context
- Suits platform teams
Weaknesses
- Requires Datadog investment
- AI is one part of a larger product
- Less AI-specialized
Best for: Enterprises standardized on Datadog wanting agent telemetry beside application monitoring.
7. Galileo AI

Galileo AI, now part of Cisco’s Splunk portfolio, goes beyond trace collection: agent metrics, failure analysis and production monitoring, with evaluations that can become real-time guardrails.
Key features
- Agent-specific observability
- Continuous evaluation
- Failure-mode analysis
- Runtime guardrails
Strengths
- Quality-first orientation
- Agent-specific monitoring
- Evals feed runtime protection
Weaknesses
- Broader than pure observability
- More platform than trace-only needs
- Check fit with existing infrastructure
Best for: Teams connecting production monitoring to continuous quality evaluation and runtime protection.
Which AI Agent Monitoring Tool Is Right for You?
Map requirements to categories:
- Open source and self-hosting: Langfuse or Arize Phoenix.
- LangChain/LangGraph stack: LangSmith.
- Monitoring plus evaluation: Braintrust or Galileo AI, especially if scoring live behavior matters as much as AI agent evaluation before release.
- Existing Datadog estate: Datadog.
- Monitoring plus governance: Opencontroller.
Check ownership too. Langfuse now sits inside ClickHouse and Galileo AI inside Cisco, so confirm roadmap commitments before standardizing.
Monitoring Shows What Agents Do. Control Decides What They May Do.
Real-time monitoring answers what an agent is doing right now. Production operations soon raise another question: what should it be allowed to do? Monitoring gives visibility, evaluation gives quality, and control gives intervention.
Keep your observability platform for tracing and quality analysis, and add a control layer for identity, policy, evaluation gates and runtime enforcement.
Opencontroller complements LangSmith, Langfuse or Phoenix rather than replacing them. Book a demo to see it against your own agent stack.
FAQs
Continuous tracking of a production agent’s steps, tool calls, cost, latency, errors and output quality, so teams see what it did and catch problems as they happen.
Step-level traces, tool-call success, latency, token cost, error rates, quality scores, safety flags and behavioral drift, with alerts on thresholds.
It depends on your stack: LangSmith for LangChain, Langfuse or Phoenix for open source, Datadog for Datadog shops, Braintrust or Galileo for evaluation-heavy teams.
Monitoring watches known signals and alerts on them. Observability lets you investigate why an agent behaved as it did. Most platforms bundle both.
Langfuse (MIT) and Arize Phoenix (Elastic License 2.0) are the leading open-source LLM observability tools. Both self-host and accept OpenTelemetry-based traces. Helicone is open source but in maintenance mode.
Yes. The core is MIT-licensed and self-hostable, and Langfuse Cloud has a free tier. Its alert monitors are available on Cloud only.
Yes, especially on LangChain or LangGraph. It covers traces, cost, latency, online evaluations and alerts, but suits fully self-hosted stacks less well.
Instrument with OpenTelemetry-compatible tracing, capture every step and tool call, score live traffic with online evaluations, and alert on cost, latency, errors and quality.
Partly. Online evaluators can flag likely hallucinations on live traces, but scores are probabilistic, so pair them with sampling and human review.
Observability records and analyzes what agents did. Governance decides what they may do through identity, policy, approval gates and runtime enforcement.
Book A Demo: Click Here
Join our Slack: Click Here
Link to our GitHub: Click Here