
As AI agents move into production, visibility becomes essential. Teams need to understand how agents behave in real time, how reliable executions are, and how costs evolve as usage scales.
Without this visibility, diagnosing failures or optimizing performance becomes slow and reactive.
Monitoring and tracing in Lyzr Agent Studio provide structured insight into agent usage, execution health, performance trends, and credit consumption.
All telemetry is standardized using OpenTelemetry, ensuring consistent logs, trace integrity, and accurate metrics across environments.
Monitoring Overview
Monitoring provides a centralized view of agent activity and system health. It is designed to help teams quickly assess overall behavior without diving into individual executions.

Monitoring highlights:
- Execution volume and frequency
- Success and failure signals
- Performance and cost patterns
With OpenTelemetry standardization, monitoring data is structured and trace-backed, making it reliable for ongoing operational analysis rather than surface-level inspection.
Administrative Oversight
Monitoring access is role-aware and supports enterprise governance.
- Owners and Admins can view data across all users and agents
- Individual users see only their own executions
This ensures centralized visibility without disrupting development workflows.
Execution Status Visibility
Each execution is surfaced with an explicit outcome.
- Successful runs
- Failed runs
This allows teams to detect reliability issues early and validate fixes after changes are introduced.
Monitoring Dashboard
The Monitoring Dashboard provides a live snapshot of system behavior. It is typically used for quick checks during active usage or after deployments.
From this view, teams can:
- Spot sudden spikes in agent usage
- Detect drops in execution reliability
- Notice unexpected increases in credit consumption
All metrics are trace-linked, allowing immediate drill-down when anomalies appear.
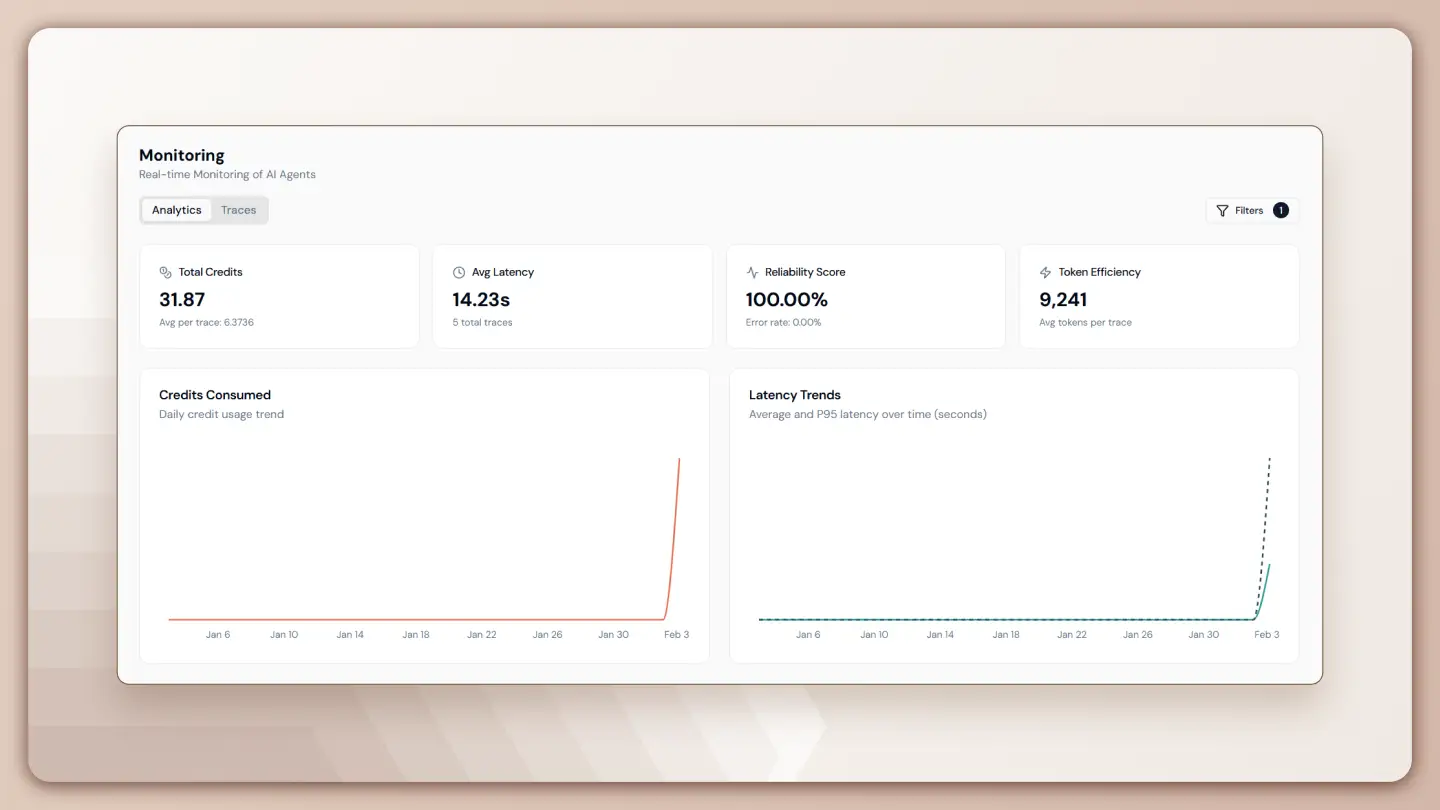
Analytics Dashboard
The Analytics Dashboard is designed for deeper analysis and long-term optimization. Instead of focusing on individual runs, it surfaces patterns that develop over time.

This dashboard helps teams:
- Compare performance across agents
- Identify cost drivers
- Track stability and efficiency trends
Key Metrics Explained
| Metric | What it Measures | Why it Matters |
|---|---|---|
| Total Credits | Aggregate credits consumed across executions, including average cost per trace | Tracks overall spend and compares agent cost efficiency |
| Avg Latency | Mean end-to-end execution time in seconds | Reflects user experience and highlights slow agents |
| Reliability Score | Percentage of successful executions in real time | Serves as a primary stability indicator |
| Token Efficiency | Average tokens consumed per trace | Enables prompt optimization and cost control |
Performance Charts
Performance charts make operational trends visible and actionable. They help teams understand how reliability, performance, and cost evolve rather than inspecting isolated data points.
Key charts include:
- Error Rate trends to identify execution failures
- Token Usage breakdown to analyze cost contributors
- Latency trends using both average and P95 values
These charts support data-driven decisions around prompts, workflows, and model selection.
Tracing

Tracing provides execution-level visibility into how agents operate internally. While monitoring shows aggregated behavior, tracing reveals the exact flow of a single execution.
Tracing enables teams to:
- Inspect execution paths
- Validate tool calls
- Investigate latency and failures
Each trace captures the full lifecycle of an agent run.
Root Traces
The root traces view lists individual executions with key identifiers and metrics.
Each trace includes:
- Trace ID for precise tracking
- Execution duration
- Token and credit consumption
This makes it easy to correlate reported issues with specific runs.
Enhanced Filtering
As execution volume grows, filtering becomes critical. Filters allow teams to isolate relevant traces without manually scanning large datasets.
Available filters include:
- Date range selection (up to 31 days)
- Agent name
- User (Admin access)
Filtering transforms large volumes of data into focused, actionable views.
Debugging and Detailed Logs
Selecting a trace opens a detailed inspection view of the agent’s internal operations. This view supports deep debugging and validation.

The detailed view enables teams to:
- Inspect execution sequences
- Identify slow operations
- Verify tool and model behavior
Trace Timeline and Span Duration
The trace timeline presents an operation-level waterfall view, while span durations show how long each step takes. Together, they help teams pinpoint bottlenecks and remove uncertainty from performance analysis.
Detailed Metadata and Logs

Every trace exposes structured metadata and raw execution logs to support transparency and auditability.
Metadata includes:
- Agent ID
- Organization ID
- User ID
- LLM model used, such as gpt-5-mini
Execution logs capture internal events, tool inputs and outputs, and system messages, enabling rigorous debugging and compliance workflows.
Closing Perspective
Monitoring and tracing are foundational for operating AI agents at scale. They enable teams to measure reliability, optimize performance, and control costs with confidence.
By combining standardized telemetry, execution-level tracing, and role-aware access, Lyzr Agent Studio ensures AI agents can be deployed and operated responsibly in production.
Book A Demo: Click Here
Join our Slack: Click Here
Link to our GitHub: Click Here