Your APM can tell you a request returned HTTP 200 in 900 milliseconds. It can’t tell you why the model hallucinated, which document the retriever used, what a tool did, or how much the request cost.
That’s the gap LLM observability fills. It gives teams visibility into what actually happened inside each LLM request, from traces and latency to quality and cost.
Here are the tools worth evaluating for LLM observability in production.
TL;DR
- LangSmith: Framework-native tracing and evaluation for LangChain/LangGraph teams.
- Langfuse: Open-source, self-hostable tracing, prompts and evaluation for teams that need data control.
- Arize Phoenix: OpenTelemetry-native tracing with easy local debugging and a production path through Arize.
- Braintrust: Evaluation-first monitoring where production traces become regression tests.
- Datadog LLM Observability: AI telemetry inside an existing APM stack.
- Portkey and Maxim AI: Gateway-level observability with routing and guardrails (Portkey), or simulation plus evaluation plus monitoring (Maxim).
What Is LLM Observability?
LLM observability is the practice of tracing, monitoring and analyzing how AI applications behave in production: model calls, prompts, outputs, latency, tokens, cost, retrieval, tool calls and quality signals. Conventional monitoring tells you a system is running. Observability lets you reconstruct why one request went wrong.
| Monitoring | LLM observability |
| Is the service up? | What happened inside the AI request? |
| Latency and error rate | Model latency, token usage, cost |
| HTTP status | Output quality and evaluation |
| Infrastructure health | Retrieval, tool and model behavior |
How the Tools Compare
| Tool | Architecture | Self-host | OpenTelemetry | Evals | Cost tracking | Agent/tool tracing |
| LangSmith | SDK | Partial | ✓ | ✓ | ✓ | ✓ |
| Langfuse | SDK | ✓ | ✓ | ✓ | ✓ | ✓ |
| Arize Phoenix | SDK | ✓ | ✓ | ✓ | ✓ | ✓ |
| Braintrust | SDK | Partial | ✓ | ✓ | ✓ | ✓ |
| Datadog | Infrastructure-native | No | ✓ | ✓ | ✓ | ✓ |
| Portkey | Gateway | Partial | ✓ | Partial | ✓ | Partial |
| Maxim AI | SDK plus simulation | Partial | ✓ | ✓ | ✓ | ✓ |
Partial means an Enterprise tier, in-VPC option or narrower coverage.
The 7 Best Tools for LLM Observability in Production
1. LangSmith
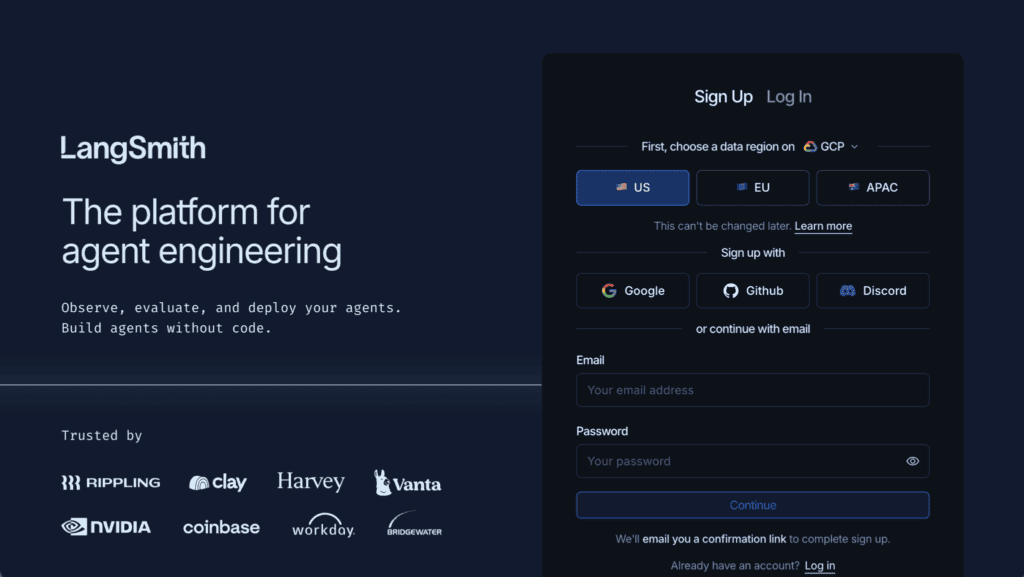
LangSmith is framework-native observability: tracing, datasets, experiments and production monitoring built around LangChain and LangGraph, usable with other frameworks.
Key features
- Nested run traces
- Datasets and experiments
- Online evaluation
- Production monitoring
Strengths
- Deep LangGraph debugging
- Evals beside traces
- Mature ecosystem
Weaknesses
- Best fit inside LangChain
- Weaker for self-hosted stacks
- Heavy for basic logging
Best for: Teams already building on LangChain or LangGraph.
2. Langfuse

Langfuse is open-source (MIT) observability covering tracing, prompt management, datasets and evaluation, now owned by ClickHouse. Self-hosting keeps prompts and outputs inside your environment.
Key features
- Self-hostable traces
- Prompt management
- Token and cost tracking
- OpenTelemetry-based
Strengths
- Data residency control
- Broad framework support
- Active open-source community
Weaknesses
- You run the infrastructure
- Alerts are Cloud-only
- Narrow governance
Best for: Teams needing open-source, data-controlled tracing.
3. Arize Phoenix

Phoenix is OpenTelemetry-native (via OpenInference) tracing and evaluation that runs in a notebook or one container. Production alerting and scale come through Arize AX.
Key features
- OpenInference tracing
- RAG debugging
- Built-in evaluators
- Local or self-hosted
Strengths
- Fast local debugging
- Vendor-neutral instrumentation
- Free to run
Weaknesses
- Elastic License, not OSI open source
- Alerting requires AX
- Self-run operations
Best for: Engineers debugging RAG and agents who want standards-based telemetry with a managed path later.
4. Braintrust
Braintrust is evaluation-first: production traces convert into datasets, and the same scorers run on live traffic and in CI.
Key features
- Trace capture
- Online scoring
- Score-threshold alerts
- Trace-to-dataset conversion
Strengths
- Tight production-to-regression loop
- OpenTelemetry ingestion
- Managed, no infrastructure
Weaknesses
- Self-hosting needs an Enterprise agreement
- Evaluation-heavy for telemetry-only needs
- Not infrastructure-native
Best for: Teams that treat quality regressions like failing tests.
5. Datadog LLM Observability

Datadog adds LLM and agent traces to the APM stack you already run, correlating model calls with services and infrastructure. Its docs now call the product Agent Observability.
Key features
- LLM and agent traces
- Online evaluations
- Dashboards and monitors
- APM correlation
Strengths
- One stack for app and AI
- Strong infrastructure context
- Familiar operations workflows
Weaknesses
- Requires Datadog investment
- Less AI-specialized
- No self-hosting
Best for: Enterprises standardized on Datadog.
6. Portkey

Portkey observes at the gateway: every model request is routed, logged and governed in one path, with fallbacks and guardrails. Palo Alto Networks closed its acquisition in May 2026, folding it into Prisma AIRS. Compare options in Lyzr’s LLM gateway comparison.
Key features
- Routing and fallbacks
- Request logs and cost
- Guardrails
- OpenTelemetry ingestion
Strengths
- Sees all model traffic
- Cost controls in the request path
- Minimal code change
Weaknesses
- Sees requests, not application logic
- Ownership now sits in a security vendor
- Partial agent traces
Best for: Platform teams centralizing model access.
7. Maxim AI

Maxim connects distributed tracing and online evaluation to agent simulation, so production failures can become test scenarios.
Key features
- Distributed tracing
- Online evaluation
- Agent simulation
- In-VPC deployment
Strengths
- Lifecycle coverage
- No-code workflows for product teams
- Enterprise compliance posture
Weaknesses
- Newer platform (launched 2025)
- Broader than tracing-only needs
- Smaller open-source ecosystem
Best for: Teams wanting evaluation, simulation and monitoring in one workflow.
How LLM Observability Tools Differ by Architecture
- SDK-based: LangSmith, Langfuse, Phoenix, Braintrust and Maxim instrument the application and capture traces.
- Gateway-based: Portkey observes requests passing through an intermediary, as does Helicone, now in maintenance mode after Mintlify’s March 2026 acquisition. See Lyzr’s LLM gateway architecture guide.
- Infrastructure-native: Datadog folds AI telemetry into existing APM.
Self-hosted inference adds a fourth signal: vLLM exposes Prometheus metrics and OpenTelemetry traces for queue depth, KV cache and throughput, complementing application traces. These layers combine well. Agents add another need: hierarchical traces and tool-call context, covered in AI agent observability.
How to Choose
- On LangChain or LangGraph? LangSmith fits most naturally.
- Need self-hosting or data residency? Compare Langfuse and Phoenix.
- Standardized on Datadog? Keep AI telemetry there.
- Want gateway and observability together? Look at Portkey.
- Want evaluation tied to production? Compare Maxim and Braintrust on evaluation depth; AI agent evaluation tooling varies widely.
- Running multi-step agents? Prioritize hierarchical traces over token dashboards.
Where Observability Ends and Control Begins
Observability tells you what happened inside model and application workflows. An AI Control Plane governs the agents producing them: identity, permissions, evaluation gates, deployment state and policy. Once observability shows a failure, production AI still needs to decide which versions are approved and what happens when an evaluation or policy check fails.
Lyzr Opencontroller sits above your existing LangSmith, Langfuse, Phoenix or Datadog telemetry rather than replacing it, supporting AI agent governance across frameworks and clouds.
Explore Opencontroller or book a demo to see how it can support your AI infrastructure.
FAQs
Tracing and analyzing how AI applications behave in production, including prompts, outputs, latency, tokens, cost, retrieval, tool calls and quality.
Monitoring tracks system health, such as uptime and error rate. Observability reconstructs what happened inside an AI request and whether the output was good.
Full traces, token usage, cost, latency, errors, retrieval and tool calls, plus evaluation scores for output quality.
Langfuse (MIT) and Arize Phoenix (Elastic License 2.0) lead. Both self-host and support OpenTelemetry-based tracing.
Yes, for teams wanting open-source tracing, prompt management and evaluation with data control. Its alert monitors are Cloud-only.
Yes. Datadog LLM Observability, now branded Agent Observability, traces LLM and agent workflows and runs online evaluations alongside APM.
LLM observability covers model calls and application workflows. Agent observability adds multi-step trajectories, tool decisions and handoffs.
Yes. vLLM exposes Prometheus metrics and OpenTelemetry traces for server behavior. Pair them with application-side tracing for full coverage.
Tracing records a request’s path. Observability adds metrics, evaluation and analysis to explain why behavior changed.
Not necessarily. Datadog’s LLM module may suffice; dedicated tools add deeper evaluation and prompt workflows.
Book A Demo: Click Here
Join our Slack: Click Here
Link to our GitHub: Click Here