The short answer
- Lyzr Opencontroller: Best for enterprises that need AI agent observability connected to evaluation, governance, deployment, identity, and runtime control.
- Arize AI: Best for ML and AI observability, drift, embeddings, and production model monitoring.
- Monte Carlo: Best for data and AI observability where data lineage and upstream data quality matter most.
- Langfuse: Best for open-source LLM observability and self-hosted tracing.
- Traceloop: Best for OpenTelemetry-based LLM telemetry that feeds your existing backend.
- AgentOps: Best for tracing and replaying multi-step agent workflows.
- Fiddler AI: Best for explainability, fairness, and responsible AI monitoring.
- Datadog LLM Observability: Best for enterprises already running application and infrastructure monitoring on Datadog.
- Dynatrace: Best for organizations that want AI observability built into a broader full-stack, causal AI platform.
- New Relic: Best for connecting AI telemetry to an existing APM investment.
- Grafana Cloud: Best for teams building observability around open telemetry and customizable dashboards.
An AI pipeline can look healthy at the infrastructure level while the actual AI system is failing.
A model can be available, latency can be normal, and an API can return a 200 while the pipeline serves stale data, retrieves the wrong context, produces a confidently wrong answer, or lets an agent take an action nobody approved.
End-to-end AI observability connects those layers so a team can reconstruct what happened across the whole path, not just whether one service responded. That’s a different job than checking uptime, and it’s a different job depending on which layer you’re staring at.
Here are the tools worth evaluating, starting with Lyzr Opencontroller.
Who this comparison is for
Best for:
- Enterprises running multiple AI agents and AI workloads across different frameworks
- Teams that need visibility across agents, models, tools, evaluations, and runtime behavior in one place
- Organizations that need observability wired directly into governance and production controls
- Teams ready to move past dashboards into operational control of what agents are allowed to do
Not for you if:
- You only need basic application uptime and infrastructure monitoring
- You only need experiment tracking for a traditional ML model in a research pipeline
- You only need raw LLM traces with no broader agent governance requirement, in which case our guide to AI agent governance tools may be a better starting point

What does end-to-end AI pipeline observability actually mean?
End-to-end AI pipeline observability means collecting and connecting telemetry across the whole AI system, not watching one component in isolation. Traditional monitoring asks, “is the service running?” AI observability asks a harder question: what happened inside the pipeline, why did it happen, and did the system produce the result it was supposed to produce.
That second question requires coverage across: data quality and lineage, model performance and drift, LLM calls, prompts and outputs, retrieval and vector search, tool calls, full agent trajectories, latency, cost, evaluation scores, and production errors. No single telemetry stream answers all of it, which is exactly why the tools in this comparison aren’t interchangeable. A platform built to catch embedding drift in a fraud model isn’t built to stop an agent from calling a tool it shouldn’t touch, and a platform built to enforce agent policy isn’t built to run a statistical drift test on tabular features.
Retrieval quality deserves its own callout here, since a pipeline can retrieve technically relevant but practically useless context as conversations grow longer. For a deeper look at why that happens, see why LLM accuracy degrades as context grows.
How we scored each platform
Feature checklists hide more than they reveal in this category, because two tools can both claim “observability” while observing completely different things. We scored each platform against nine evaluation areas, and we weighted them differently depending on what kind of buyer is reading.
Evaluation framework
| Evaluation area | What we’re looking at |
|---|---|
| Pipeline coverage | How many AI stack layers can it actually observe? |
| LLM/agent tracing | Depth of traces across model calls and multi-step agent workflows |
| Data/ML observability | Drift, data quality, embeddings, classical model performance |
| Evaluation | Offline and online evaluations, continuous quality scoring |
| Infrastructure visibility | Application, API, GPU, vector DB, and infra-level signals |
| Production monitoring | Alerts, dashboards, anomaly detection, runtime signals |
| Open standards | OpenTelemetry and OpenInference support |
| Deployment | SaaS, self-hosted, hybrid, air-gapped enterprise options |
| Governance/control | Identity, permissions, approvals, and runtime enforcement |
A data science team weights “data/ML observability” heavily. An LLM engineering team weights “LLM/agent tracing” and “evaluation.” An enterprise running a few hundred production agents weights “governance/control” above almost everything else, because visibility without the ability to act on it just produces a better-documented incident report.
Why this matters more in 2026 than it did a year ago
Agents are shipping into production faster than most monitoring stacks were built to handle. New survey data from Monte Carlo reveals that 73% of enterprises will not ship an AI agent without monitoring and alerting, while 63.4% identify lack of monitoring and observability as a primary barrier to broader AI adoption.
Secure data handling (68%), performance expectations (62.7%), and failure monitoring (72.7%) rank as top pre-deployment requirements enterprises expect to have in place before an agent goes live, yet most organizations are still building toward that bar rather than standing on it.

That gap is the whole reason this category has split into specialists instead of consolidating into one tool. The pipeline got more complex before anyone built a platform wide enough to watch all of it at once.
Our picks
1. Lyzr Opencontroller: best for end-to-end AI agent governance and production control

Most observability tools answer one question well: what happened during this run?
Opencontroller takes a step back and asks what agents are running across the organization, who owns them, what they’re using, and what they’re costing, because observability helps you investigate a run while OpenController helps you understand and control the fleet.
That distinction matters once an organization stops running a handful of agent experiments and starts running dozens or hundreds in production, often built on different frameworks by different teams. Opencontroller provides a control layer across the existing AI stack without requiring teams to replace their models, agent frameworks, cloud infrastructure, CI/CD, identity systems, or observability platforms. It sits above what’s already there rather than competing with it.
What it actually does. On the governance side, it automatically discovers agents, models, tools, data, and workflows across the AI estate, evaluates and validates every agent and workflow before it reaches production, monitors agents, applications, APIs, and infrastructure in real time, and turns usage, performance, cost, and security signals into actionable decisions. On the deployment side, it combines a central agent registry, version and configuration history, evaluation gates that block a promotion until thresholds are met, and permission enforcement over what tools an agent can touch.
The part that separates it from a tracing dashboard shows up at runtime. Opencontroller watches the actual behavior of every agent in a cluster against the state it was approved to run in, and as soon as behavior starts drifting, whether that’s scope creep, an unexpected data access pattern, or an action outside its approved envelope, it flags the issue immediately, then blocks the action, routes it to a human for approval, or lets it through and logs exactly why, depending on policy. Every one of those decisions gets written to an audit trail built to hold up under a compliance review, not just to look tidy in a dashboard.
This works regardless of where an agent was built. It watches every agent’s live behavior against its approved state, flags or blocks drift in real time, and writes every decision to an audit trail, regardless of which framework or vendor built the agent, including agents composed from building blocks in Agentblocks. And it’s explicitly designed to coexist with what a team already runs: Opencontroller doesn’t require choosing between it and an existing observability stack, since a team can keep its current observability and evaluation tools while using Opencontroller as the control layer across its agents.
Key strengths
- Connects what happened (observability) to what should happen next (policy enforcement), rather than stopping at alerting
- Framework-neutral agent registry and discovery, so governance doesn’t depend on which SDK a team happened to build with
- Deployment flexibility that includes cloud, on-prem, and air-gapped environments for regulated workloads
Tradeoffs / not ideal if
- You need deep statistical drift detection on a traditional tabular ML model, where Arize’s embedding-centroid methods are more specialized
- You want a free, minimal, self-hosted tracing library for a single developer project, where Langfuse’s open core is the simpler starting point
- You haven’t deployed multi-step agents yet and only need to log individual LLM calls
Best for: enterprise teams that need observability connected to the full agent lifecycle, not a standalone telemetry dashboard sitting next to a separate governance project.
If the agents already running in your environment outnumber the people who can account for them, see how Opencontroller’s agent registry and evaluation gates work together before deciding whether a tracing tool alone will close that gap.
Other leading AI observability tools
2. Arize AI: best for ML and AI model observability, drift, and embeddings

Arize is built around a question LLM-native tools weren’t built to answer: has this model’s behavior shifted since it went live. The platform splits into Phoenix, which is source-available and self-hosted for prototyping and dev-time evaluation, and AX, the managed platform on the same foundation that adds online evals, drift and bias monitoring, and continual-improvement workflows at production scale.
Best for: ML and data science teams that need to catch drift, troubleshoot embedding-level issues, and evaluate RAG retrieval quality in a single workflow.
Key capabilities
- Drift detection that computes distance between embedding centroids across time windows to flag semantic shift
- RAG and retrieval monitoring, including document ranking and context quality
- Open-source Phoenix for tracing and evals, commercial AX for enterprise-scale drift and RBAC
Strengths
- One platform covers classical ML and LLM-based systems, which matters for teams running both
- Mature, production-proven drift methodology rather than a newly built heuristic
- Clear upgrade path from free open-source tooling to managed enterprise scale
Not ideal if
- You’re building a hosted product on top of the tracing layer itself; Phoenix is Elastic License 2.0, source-available: free to self-host, but not to resell as a managed service
- You need agent-level policy enforcement, not just observability
- Your biggest risk sits upstream in raw data pipelines rather than in the model itself
Where it sits in the pipeline: Data → Model → LLM, with strong retrieval visibility but limited reach into agent governance or application infrastructure.
3. Monte Carlo: best for data lineage and upstream data reliability

Monte Carlo’s premise is blunt: most AI failures are data failures wearing a model’s name tag. The newer Agent Observability layer organizes around four monitoring domains: context, which validates the data agents rely on; performance, which tracks cost, latency, and error rates; behavior, which verifies agents follow intended workflows; and outputs, which evaluates quality before and after deployment.
Best for: data-driven organizations where unreliable upstream pipelines are the biggest threat to AI system quality.
Key capabilities
- Automated data quality monitoring with lineage tracking back to source tables
- Agent Trajectory Monitors for workflow validation and pre/post-deployment output evaluations
- Expanded support for Google BigQuery and AWS Athena, plus a hosted OpenTelemetry option in AWS for simplified onboarding
Strengths
- Deep integration with the modern data stack, so AI issues can be traced back to a specific upstream table or job
- Combines data observability and agent observability in one trust loop rather than two separate products
- Strong default for teams whose AI quality problems are consistently data quality problems in disguise
Not ideal if
- You need granular span-level LLM tracing as your primary workflow
- Your priority is model explainability or fairness analysis rather than data reliability
- You want a lightweight, developer-first tool rather than an enterprise data platform
Where it sits in the pipeline: Data → (extending into) Agent context, performance, behavior, and outputs, with data lineage as the core strength.
4. Langfuse: best for open-source, self-hosted LLM tracing

Langfuse earned its position as the default open-source answer for LLM tracing. It self-hosts under an MIT license and is built around open standards and data portability. ClickHouse acquired Langfuse in January 2026 alongside a $400M Series D that tripled ClickHouse’s valuation to $15 billion, though the core tracing, evals, prompt management, and dataset features remain MIT-licensed.
Best for: engineering teams that want self-hosted, framework-agnostic LLM tracing with full data control, especially where data residency rules make a managed SaaS tool a nonstarter.
Key capabilities
- Four core capabilities: observability through traces, evaluations, prompt management, and datasets
- OpenTelemetry-native ingestion, so LangChain and LlamaIndex traces require no Langfuse-specific instrumentation
- Basic SSO via SAML or OIDC included free, with SCIM provisioning, project-level RBAC, audit logs, and data masking under a commercial Enterprise license
Strengths
- Genuinely free, unlimited self-hosting with no trace or seat caps on the core product
- Strong community adoption and broad framework coverage
- A sensible middle layer between raw OpenTelemetry and a full managed platform
Not ideal if
- You need enterprise governance (identity, permissions, policy enforcement) out of the box rather than as a paid add-on
- Self-hosting operational overhead is a dealbreaker; running it requires managing a web/API layer, workers, PostgreSQL, ClickHouse, Redis, and object storage, with a moderate-to-high learning curve
- You need drift detection on traditional ML models alongside your LLM traces
Where it sits in the pipeline: LLM → Retrieval → Agent, with no reach into infrastructure or governance layers.
5. Traceloop (OpenLLMetry): best for OpenTelemetry-native LLM instrumentation

Traceloop’s contribution to this space isn’t a dashboard, it’s a standard. OpenLLMetry is a set of extensions built on top of OpenTelemetry that gives observability over an LLM application, maintained by Traceloop under the Apache 2.0 license. Because it uses OpenTelemetry under the hood, it can be connected to existing observability backends rather than requiring a new one.
Best for: teams that already have an observability backend and need a vendor-neutral way to get LLM-specific telemetry into it.
Key capabilities
- Captures LLM-specific data points such as model name and version, prompt and completion tokens, temperature parameters, latency, and errors
- Exports to Traceloop, Dynatrace, Datadog, New Relic, Honeycomb, Grafana Tempo, and other OpenTelemetry Collectors
- Standard OpenTelemetry instrumentations for LLM providers and vector databases
Strengths
- Prevents vendor lock-in by design, since the underlying telemetry format is a public standard
- Minimal instrumentation effort for teams already on OpenTelemetry
- Works as connective tissue rather than forcing a new destination platform
Not ideal if
- You want a built-in UI for analysis, evaluation, or alerting; the instrumentation layer expects you to bring your own backend
- You need agent governance or policy enforcement
- You want out-of-the-box drift detection or data quality monitoring
Where it sits in the pipeline: LLM → Infrastructure, functioning as the telemetry layer rather than the analysis layer.
6. AgentOps: best for tracing and replaying multi-step agent sessions

AgentOps is built around a specific failure mode: an agent that ran for twelve steps, called four tools, and produced the wrong answer, with no easy way to see where it went off track. It records agent runs as hierarchical traces, shows LLM and tool activity in a visual waterfall, estimates token costs, and supports replay, export, and integration with major model providers and agent frameworks.
Best for: teams running multi-step, multi-tool agents who need to replay a specific session step by step rather than aggregate metrics across many runs.
Key capabilities
- Session replay and time-travel debugging that lets developers rewind and replay agent runs with point-in-time precision
- Integration with hundreds of agent frameworks and model providers, including CrewAI, AutoGen, LangChain, and OpenAI’s Agents SDK
- A free Basic tier that includes up to 5,000 events per month, with paid plans starting at $40/month for Pro, and custom-priced Enterprise tiers adding SOC-2, HIPAA, and self-hosting
Strengths
- Fast to integrate, with minimal code changes to start capturing traces
- Purpose-built for the operational reality of agentic systems rather than retrofitted from request-response APM
- Strong framework breadth for teams that haven’t standardized on one agent stack
Not ideal if
- You need upstream data quality or model drift monitoring
- Your priority is policy enforcement rather than after-the-fact debugging; it records what happened, it doesn’t block a call before it executes
- A production agent handling real traffic exhausts the free event allowance in days, so budget for the paid tier early
Where it sits in the pipeline: Agent → Tools, with session-level depth but limited reach into data or infrastructure layers.
7. Fiddler AI: best for explainability, fairness, and responsible AI monitoring
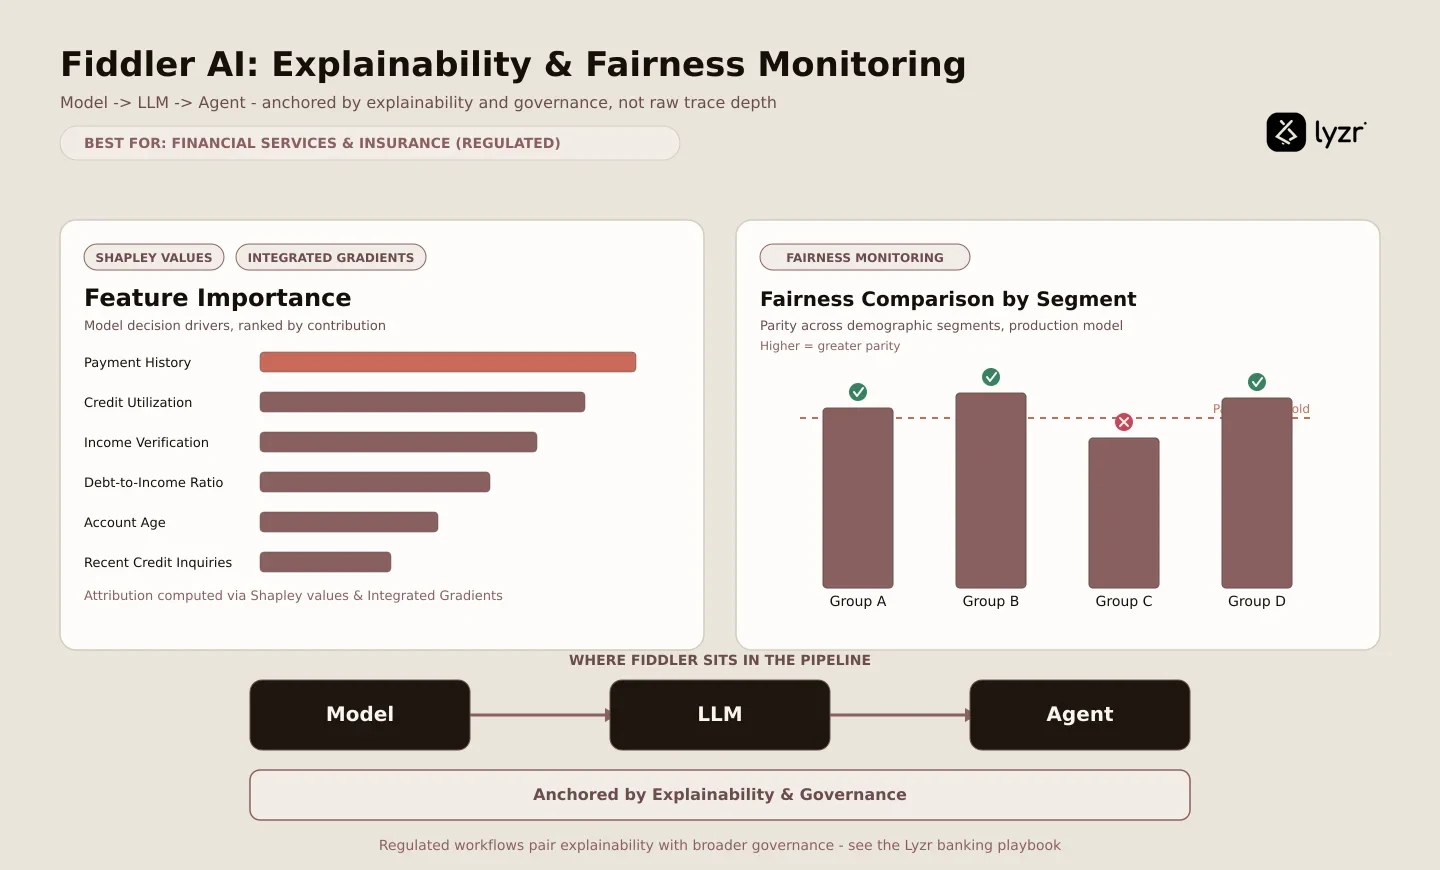
Fiddler’s angle is different from a pure tracing tool: it cares less about what happened and more about why the model decided what it decided. The platform combines explainability principles like Shapley values and Integrated Gradients with proprietary methods for model explanations, aimed squarely at teams that need to document and defend model behavior, not just watch it.
Best for: regulated industries, such as financial services and insurance, where explainability and audit evidence matter as much as raw performance monitoring. Teams in that category often benefit from pairing explainability tooling with a broader governance view; see the Lyzr banking playbook for how that plays out in regulated financial workflows.
Key capabilities
- Continuous real-time model monitoring for bias detection in both datasets and ML models
- Monitoring of agents, generative, and predictive models for accuracy, safety, and privacy, with root-cause diagnosis of model and agent behavior
- Automatic generation of audit evidence for internal reviews and external regulatory requirements
Strengths
- Explainability-first architecture, not a bolt-on feature
- Strong fit for frameworks like the NIST AI RMF
- Covers both classical ML fairness analysis and newer generative/agentic monitoring
Not ideal if
- Your priority is lightweight developer tracing rather than enterprise compliance workflows
- You need agent-level runtime enforcement, not just monitoring and explanation
- You’re not in a regulated industry where fairness and audit documentation carry weight
Where it sits in the pipeline: Model → LLM → Agent, anchored by explainability and governance rather than raw trace depth.
8. Datadog LLM Observability: best for teams already standardized on Datadog APM

Datadog’s pitch is consolidation: monitor AI the same place you monitor everything else. Each request is represented as a trace that captures the initial prompt, retrieval steps, tool calls, model responses, and postprocessing, correlated directly with the rest of the application stack.
Best for: enterprises with an existing Datadog deployment who want AI telemetry correlated with application and infrastructure signals without adding a new vendor.
Key capabilities
- Out-of-the-box evaluations that surface hallucinations, prompt injection attempts, PII exposure, and sentiment drift automatically
- Context unification that correlates LLM agent behavior with backend APM services, infrastructure signals, and real user monitoring sessions in the same platform
- Framework auto-instrumentation covering major LLM providers and agent SDKs
Strengths
- Zero new tool to adopt if Datadog is already the operational center of gravity
- Strong correlation between an LLM span and the exact downstream service or query that slowed it down
- Pre-built dashboards and alerting that plug into existing on-call workflows
Not ideal if
- You need deep ML-specific drift or embedding analysis
- Your priority is agent governance and policy enforcement rather than infrastructure correlation
- You’re not already paying for Datadog APM; adopting it purely for AI observability is a heavier lift than a specialized tool [VERIFY current pricing tiers directly with Datadog before procurement]
Where it sits in the pipeline: LLM → Application → Infrastructure, with its core strength in correlating AI behavior to the rest of the stack.
9. Dynatrace: best for full-stack, causal AI observability

Dynatrace extends its Davis AI engine into the AI stack rather than bolting on a separate product, aiming for a unified view across model and provider calls, orchestration frameworks, vector databases, agent topology, and infrastructure. It ingests telemetry from its own agent, native OpenTelemetry, OpenInference, or OpenLLMetry, surfacing all of it in one consistent experience, with agent topology mapping to show how agents call each other and which models and tools they depend on in real time.
Best for: enterprises that want AI telemetry folded into an existing causal root-cause analysis platform rather than a standalone AI tool.
Key capabilities
- Production AI quality evaluation enabling LLM-as-judge scoring of live responses to catch quality regressions
- Guardrail monitoring for toxic language, PII leakage, prompt injection attempts, and hallucinations
- Full-stack infrastructure extension to compute and GPU resources, automatically capturing utilization and memory statistics with real-time anomaly detection
Strengths
- Davis AI’s causal, deterministic root-cause analysis is a genuine differentiator over purely statistical anomaly detection
- Deep infrastructure-to-application correlation, including GPU-level visibility
- Vendor-neutral ingestion means it doesn’t force a single instrumentation approach
Not ideal if
- Its deterministic, causal approach trades off some of the statistical drift detection and indirect-causality mapping that AI-native platforms specialize in
- You need agent policy enforcement rather than observation and alerting
- You’re not already operating at the scale where a full-stack APM platform makes sense [VERIFY current licensing tiers before procurement]
Where it sits in the pipeline: LLM → Agent → Infrastructure, with its strongest value at the infrastructure and topology layers.
10. New Relic: best for AI telemetry inside an existing APM investment

New Relic’s approach is incremental rather than ground-up: extend the APM agent teams already run to understand AI calls too, bringing observability to the AI stack with full visibility across performance, quality, cost, and compliance signals.
Best for: organizations already invested in New Relic that want AI telemetry inside existing dashboards and alerting without adopting a separate tool.
Key capabilities
- Automatic detection of LLM API calls through the existing language agent, feeding them into AI Monitoring without additional code changes
- An SRE-oriented investigative agent that begins reasoning through a performance risk, such as a spike in hallucination rates, as soon as it’s detected
- Pre-configured dashboards and alerts for AI application performance and health
Strengths
- Fastest path to AI visibility for teams already running New Relic’s language agents
- Correlates AI spans with the same incident response and SLO workflows already in place
- Strong breadth across hosts, services, Kubernetes, and browser sessions alongside AI spans
Not ideal if
- You need output-quality evaluation or AI-specific debugging workflows beyond token economics and performance tracking
- You need dedicated drift detection, embedding analysis, or agent policy enforcement
- You want the depth of a dedicated LLM-observability ecosystem rather than an APM extension
Where it sits in the pipeline: LLM → Application → Infrastructure, functioning as an extension of existing APM rather than a purpose-built AI platform.
11. Grafana Cloud: best for OpenTelemetry-native, customizable AI dashboards

Grafana’s entry leans into its open-source roots rather than building a proprietary tracing SDK, using automatic instrumentation built on OpenTelemetry to capture every generation an agent makes, organize them into conversations, track agent versions, and evaluate quality continuously.
Best for: teams already running Grafana, Tempo, and Prometheus who want AI telemetry inside the same open-source-aligned stack rather than adopting a proprietary dashboard.
Key capabilities
- Prebuilt dashboards analyzing response times, error rates, throughput, token usage, and costs across the AI stack
- Pre-built views for GenAI, vector databases, agents, and Model Context Protocol telemetry, covering latency percentiles, token and cost metrics, and evaluation results
- Agent conversations and sessions treated as first-class telemetry signals alongside existing metrics, logs, and traces
Strengths
- Genuinely open, vendor-neutral instrumentation through open standards
- Natural fit for teams that have already standardized on Grafana for infrastructure observability
- Flexible, highly customizable dashboarding rather than a fixed UI
Not ideal if
- You need a mature, generally available evaluation workflow; some AI-specific evaluation features were still in preview as of this writing [VERIFY current release status]
- You need built-in drift detection or data lineage
- You want a managed, opinionated AI-specific UI rather than building your own dashboards
Where it sits in the pipeline: LLM → Agent → Infrastructure, strongest where a team already lives in the Grafana/Tempo/Prometheus ecosystem.
Side-by-side comparison
AI pipeline observability tools compared
| Tool | Best for | ML/Data | LLM tracing | Agent observability | Evaluation | Open source | Enterprise deployment | Governance |
|---|---|---|---|---|---|---|---|---|
| Lyzr Opencontroller | Agent governance & runtime control | Partial | ✓ | ✓ | ✓ | — | ✓ | ✓ |
| Arize AI | ML/AI drift & embeddings | ✓ | ✓ | Partial | ✓ | Partial | ✓ | Partial |
| Monte Carlo | Data lineage & agent trust | ✓ | Partial | ✓ | ✓ | — | ✓ | Partial |
| Langfuse | Open-source LLM tracing | — | ✓ | Partial | ✓ | ✓ | Partial | Partial |
| Traceloop | OTel-native LLM telemetry | — | ✓ | Partial | — | ✓ | Partial | — |
| AgentOps | Multi-step agent session tracing | — | ✓ | ✓ | Partial | Partial | Partial | Partial |
| Fiddler AI | Explainability & responsible AI | ✓ | ✓ | Partial | ✓ | — | ✓ | ✓ |
| Datadog LLM Observability | Unified APM + AI telemetry | Partial | ✓ | ✓ | ✓ | — | ✓ | Partial |
| Dynatrace | Full-stack causal AI observability | Partial | ✓ | ✓ | ✓ | — | ✓ | Partial |
| New Relic | AI telemetry in existing APM | — | ✓ | Partial | Partial | — | ✓ | — |
| Grafana Cloud | OTel-native custom dashboards | — | ✓ | Partial | Partial | Partial | ✓ | — |
The point of this table isn’t to make Opencontroller win every box. It’s to make the architectural difference visible: governance and agent observability cluster around a different set of tools than ML drift and data lineage do.
How to choose
Choose Lyzr Opencontroller if you need observability connected to agent governance, evaluation gates, deployment promotion, identity, permissions, and runtime control across frameworks.
Choose Arize if your priority is ML and AI model observability, embedding drift, and evaluation at production scale.
Choose Monte Carlo if data quality, lineage, and upstream reliability are the central risk in your AI pipeline. Your biggest fear is “garbage in, garbage out,” and you need to catch it before it reaches the model.
Choose Langfuse if you want open-source, self-hosted LLM tracing with prompt management and evaluation workflows under an MIT license.
Choose Traceloop if you already have an observability backend and just need standards-based LLM instrumentation to feed it.
Choose AgentOps if your primary need is replaying and debugging specific multi-step agent sessions.
Choose Fiddler if explainability, fairness, and regulatory audit evidence matter as much as raw monitoring.
Choose Datadog if your organization already runs application and infrastructure observability through Datadog and wants AI correlated into the same view.
Choose Dynatrace, New Relic, or Grafana if you want AI telemetry incorporated into an existing broader observability environment rather than adopting a dedicated AI platform.
A practical AI observability checklist
Before signing anything, ask the vendor these questions directly:
- Can it trace the complete AI request, not just the final model call?
- Can it connect model calls with retrieval steps and tool calls in one view?
- Can it identify where in the pipeline a failure actually originated?
- Can it evaluate output quality, not just latency and cost?
- Can it monitor data or model drift where that risk applies to your workload?
- Can it connect AI telemetry with existing infrastructure and application telemetry?
- Where is the telemetry stored, and does that satisfy your data residency requirements?
- Can it be self-hosted or deployed in the environment compliance actually requires?
- Does it support OpenTelemetry or OpenInference, or does it lock you into a proprietary format?
- Can it connect observability to governance and production controls, or does it stop at alerting?
- Can it support multiple agent frameworks without separate instrumentation for each?
- Can it produce an audit trail that holds up under a compliance review?
There is no single best tool, because the pipeline has no single layer
Pick based on where your AI system actually breaks, not on which vendor has the most dashboards. A data science team watching a fraud model cares about drift and embeddings. An LLM engineering team shipping a RAG application cares about traces and retrieval quality. An enterprise running hundreds of agents across multiple frameworks cares about something else entirely: whether anyone can say, with an audit trail to back it up, what every agent is allowed to do and whether it stayed inside that boundary.
That third problem is the one most observability tools weren’t built to solve, because they were built to watch, not to govern. If the agents in your environment have outgrown what a tracing dashboard can account for, Opencontroller connects evaluation, observability and runtime enforcement into one control plane. It sits on top of the tools you already run rather than replacing them.
If you want to see how that maps onto your stack, including whatever mix of Langfuse, Datadog or Arize you use today, Explore Opencontroller or book a demo with the Lyzr team and bring your own environment.
Frequently asked questions
What is AI pipeline observability?
AI pipeline observability is the practice of collecting and connecting telemetry across every stage of an AI system, from data ingestion through model inference to agent actions in production, so a team can understand not just whether the system is running but whether it’s producing correct, safe, and expected results.
What is the difference between AI observability and traditional monitoring?
Traditional monitoring asks whether a service is up and tracks deterministic signals like CPU, memory, and HTTP error codes. AI observability matters more for silent failures: the job succeeds, the API returns 200, but the data is wrong, the retrieved context is irrelevant, or the model produces confidently incorrect output.
What should an end-to-end AI observability platform track?
At minimum: data quality and lineage, model performance and drift, LLM prompts and outputs, retrieval quality, tool calls, full agent trajectories, latency, cost, evaluation scores, and production errors. Few platforms cover all of these equally well, which is why layered buying is the realistic approach.
What are the best AI observability tools?
It depends entirely on which layer is failing. Lyzr OpenController, Arize, Monte Carlo, Langfuse, Traceloop, AgentOps, Fiddler, Datadog, Dynatrace, New Relic, and Grafana Cloud each lead in a different part of the pipeline, from data lineage to agent governance to full-stack APM correlation.
What is the best AI observability tool for LLMs?
For open-source, self-hosted LLM tracing, Langfuse is the common default. For teams needing drift and embedding analysis alongside LLM traces, Arize is stronger. For enterprises that need LLM observability tied to agent governance and runtime enforcement, OpenController extends further up the stack.
Which AI observability tools are open source?
Langfuse’s core tracing, evaluations, prompt management, and dataset features are MIT-licensed and self-host without usage limits. Traceloop’s OpenLLMetry instrumentation is Apache 2.0. Arize Phoenix is source-available under the Elastic License 2.0, free to self-host but not licensed for resale as a managed service, which is a meaningfully different grant than a permissive license like MIT or Apache. Always check the specific license terms for enterprise features, since many “open-source” platforms gate SSO, RBAC, and audit logging behind a commercial edition.
What is the difference between ML observability and LLM observability?
ML observability generally focuses on structured, tabular data and statistical drift in classical models. LLM observability focuses on unstructured text, prompt-level tracing, and evaluating the quality of generated content, which requires a different telemetry shape entirely: span trees and judge-model scoring rather than feature distributions.
Do I need AI observability if I already use Datadog?
Possibly not for basic telemetry, since Datadog LLM Observability correlates AI spans with your existing APM data out of the box. You may still need a specialized tool for deep embedding drift analysis, which falls outside Datadog’s scope, or a dedicated governance layer if your concern is enforcing agent policy rather than observing infrastructure.
What is the difference between AI agent observability and LLM observability?
LLM observability typically covers a single call or a simple chain. Agent observability covers the full multi-step lifecycle of a system that reasons, calls tools, and takes actions over time, which requires tracing an entire trajectory rather than one request-response pair. For a deeper breakdown of how to score agent-level behavior, see our comparison of multi-agent evaluation and benchmarking tools.
Can AI observability tools also govern AI agents?
Most can’t, and that’s the gap worth understanding before you buy. A governance layer sits in the path of every agent and model call to enforce policy, while open-source and tracing tools sit beside the path to record what happened after the fact. Seeing what an agent did and controlling what it’s allowed to do next are different capabilities, and a platform built for one doesn’t automatically do the other.
Book A Demo: Click Here
Join our Slack: Click Here
Link to our GitHub: Click Here