Your LLM bill went up thirty times and nothing broke. No errors, no outages, every request returned 200. Somewhere inside each answer, your agent started thinking a lot harder than it needed to, and you are paying for every extra thought.
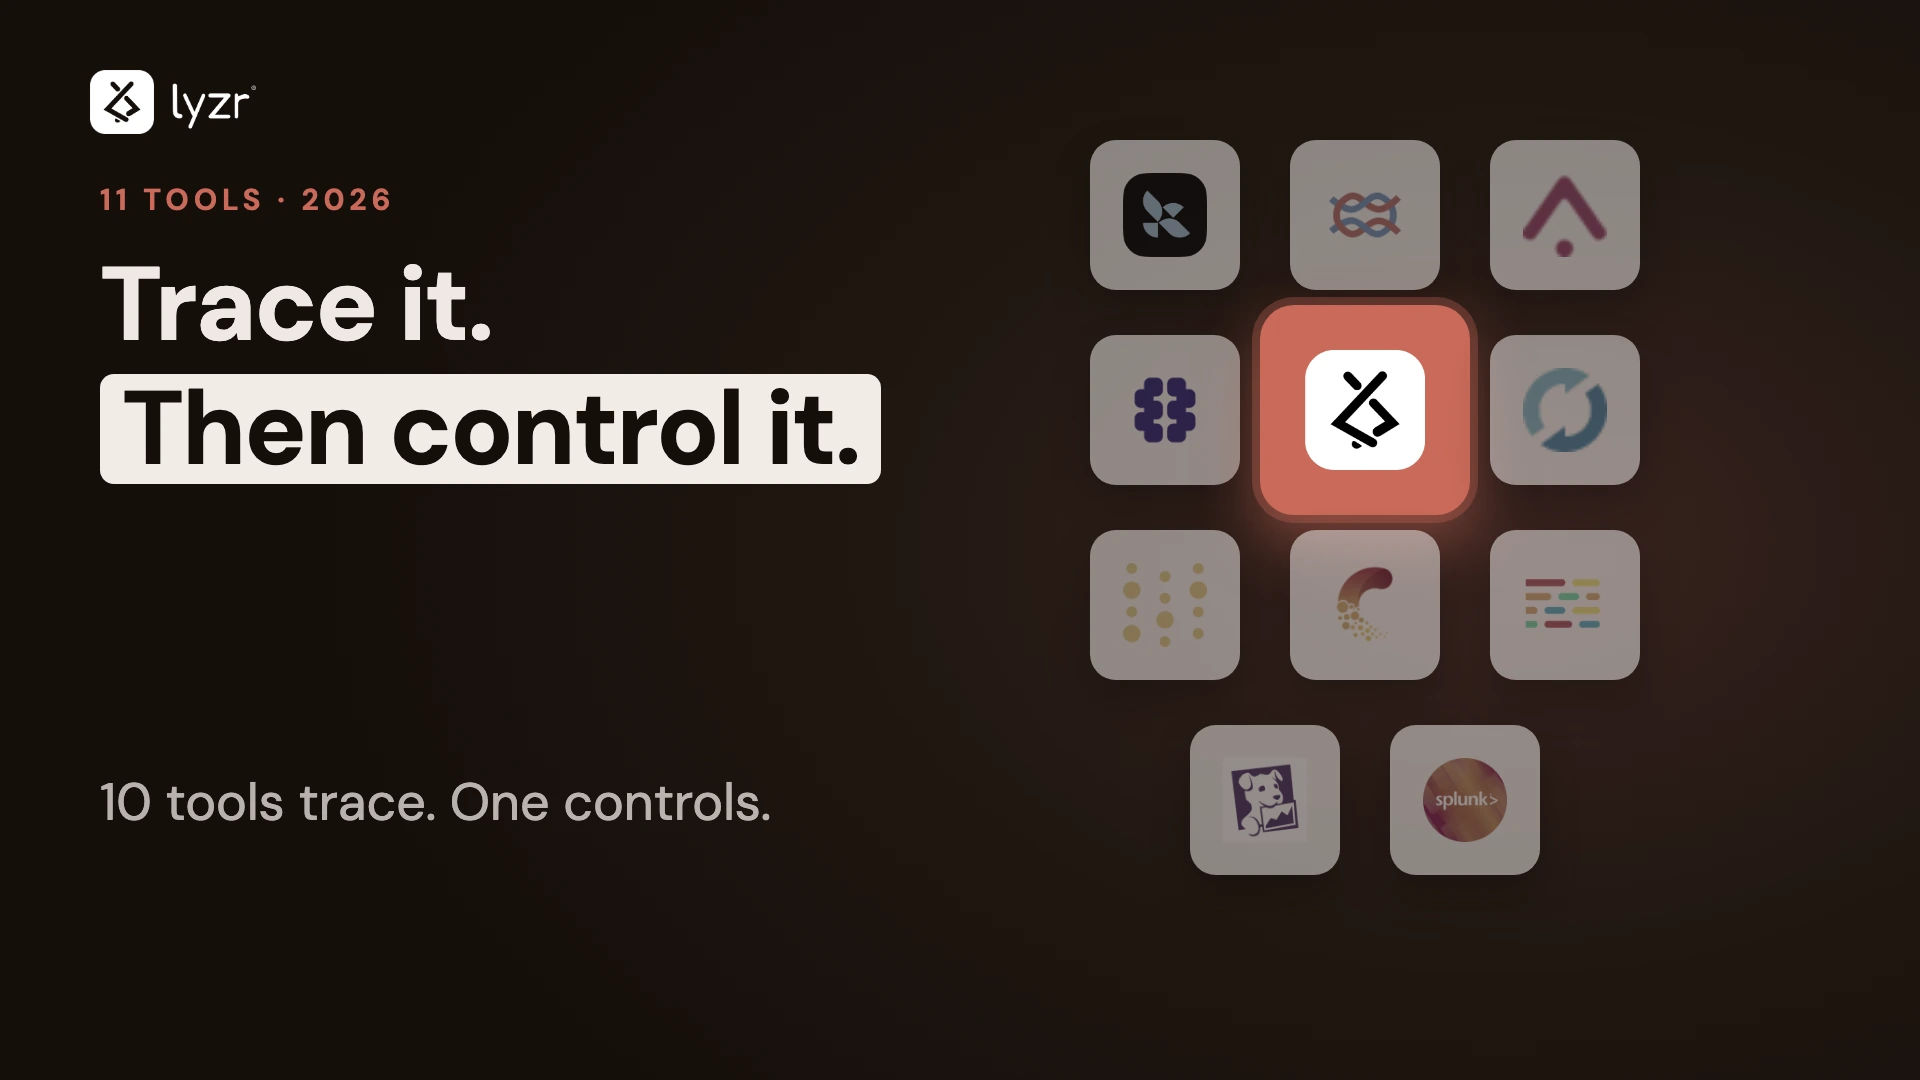
This guide shows what LLM tracing actually reveals, compares 11 tools on the same 8 criteria, and helps you decide whether you need a tool that only shows you the problem or one that can also stop it.
Get the short answer
- ✓Lyzr Open ControllerBest overall for enterprises. Traces LLM and agent activity, attributes every dollar of model spend, and enforces spend, access and policy before the call runs. Your cloud, flat annual fee.
- ✓LangfuseBest open-source tracer to self-host.
- ✓LangSmithBest for LangChain and LangGraph developers.
- ✓Arize PhoenixBest OpenTelemetry-native open-source option.
- ✓BraintrustBest when traces must feed evals and CI gates.
- ✓MLflow TracingBest for Databricks and MLflow teams.
- ✓W&B WeaveBest for teams already on Weights & Biases.
- ✓Comet OpikBest lightweight open-source tracing plus evals.
- ✓OpenLLMetryBest vendor-neutral instrumentation layer.
- ✓Datadog LLM ObservabilityBest for Datadog-standardized teams.
- ✓Splunk Agent ObservabilityBest for Splunk and Cisco shops.
See what a single trace shows you
- LLM tracing records every step inside one request: prompts, model calls, retrievals, tool calls, tokens, cost and latency.
- Each step is a span. Spans nest inside the step that triggered them, forming a trace tree you can replay.
- A log says a request happened. A trace shows why it ended the way it did, and what each step cost.
Illustrative example. Structure mirrors EY’s 2026 comparison of a $0.04 linear chat versus a $1.20 orchestrated agent interaction.
- Bad retrieval
- Wrong tool or arguments
- Loops and retries
- Tokens per span
- Cost per agent, team, model
- Context bloat
- Evidence for audit
- Owner of each agent
- Version that ran
Know why tracing became urgent in 2026
- Agents multiplied the spans. One answer now fans out into planning, retrieval, tools, sub-agents and retries. Flat logs cannot show that shape.
- Cost became a debugging problem. Without a trace, a rising bill cannot be tied to a step, an agent or a team.
- Governance became the failure point. Gartner’s Shiva Varma put the root cause plainly: enterprises treat agent governance as binary, “either locked down or fully trusted.”
- Your tracing vendor may change owners. The category consolidated fast:
- ClickHouse acquired Langfuse; Langfuse stays MIT-licensed and self-hostable.
- Mintlify acquired Helicone, which moved to maintenance mode. Traceloop, maker of OpenLLMetry, was reported acquired by ServiceNow.
- Cisco completed its acquisition of Galileo.
- Galileo was renamed Splunk Agent Observability.
Hear what enterprise platform teams tell us
These themes come up again and again when we talk to AI platform, security and finance leaders running agents in production.
- Nobody can list every agent running today.Agents live in LangChain code, CrewAI projects, notebooks and inside SaaS platforms like Salesforce and Snowflake.A tracer only sees what you instrument. You also need discovery.
- The LLM bill arrives before anyone can explain it.Finance asks which team or agent drove the increase, and the answer takes days of log digging.Cost must be attributed per agent, developer, project and model, not per API key.
- Security wants prompts and traces kept inside the company’s cloud.Traces carry customer records and proprietary logic.Where traces live is a buying criterion, not a footnote.
- Developers already love their tracer.Nobody wants to rip out Langfuse or LangSmith.Pick a production layer that keeps developer tools fully intact.
- After an incident, the first question is who owns the agent.It often takes far too long to answer.Ownership and identity belong next to the trace.
See how we scored every tool
- 11 tools, 8 criteria, same yardstick for all, including Lyzr. We name where other tools are the better pick.
- Sources: vendor documentation, public announcements, G2, Gartner Peer Insights and community discussion. Editorial assessment as of September 2026.
1. Lyzr Open Controller: trace, cost and control every LLM call
Lyzr Open Controller gives you the trace your developers need and the control your business needs, for every agent and model call across your company, running inside your own cloud.
Lyzr, the company
- Enterprise AI agent platform: build with Agent Studio and Architect, govern with Open Controller
- New York headquarters, Bengaluru engineering hub, teams across the US, India, UK and Dubai
- Focused on banking, financial services, insurance, healthcare and the public sector
- Technology partners: AWS, Google Cloud, Microsoft Azure, NVIDIA
Open Controller, the product
- Universal control plane for any cloud, framework, model and runtime
- Shows which agents call which models, where they run, and what they cost
- Enforces identity, spend and policy in the request path
- Runs in your cloud or on-prem, fully air-gapped if needed
- Flat annual fee: unlimited agents, users, logs and usage
Solve the tracing problem and the ten that come after it
- Tracing answers one question: what happened inside this call.
- The moment you can see it, ten more questions arrive: who owns it, what did it cost, can we cap it, can we stop it, where is the data.
- Most teams answer those with five more tools. Lyzr Open Controller answers them on one platform, with control and data staying with you.
| What you need to do | Tracing tool | APM extension | Lyzr Open Controller |
|---|---|---|---|
| See every step of a run | ● Yes | ◐ Partial | ● Yes |
| Attribute cost to agent, developer, project, model | ◐ Partial | ◐ Partial | ● Yes |
| Cap spend before the call runs | ○ No | ○ No | ● Yes |
| Find every agent that exists, including SaaS agents | ○ No | ○ No | ● Yes |
| Name an owner for each agent | ○ No | ○ No | ● Yes |
| Limit what each agent can access | ○ No | ○ No | ● Yes |
| Refuse a call that breaks policy | ○ No | ○ No | ● Yes |
| Stop a misbehaving agent right now | ○ No | ○ No | ● Yes |
| Roll back to a known-good version | ○ No | ○ No | ● Yes |
| Keep traces, prompts and IP in your environment | ◐ If self-hosted | ○ No | ● Yes |
| Pay the same as agent volume grows | ○ No | ○ No | ● Yes |
| Deepest single-framework debugging UI | ● LangSmith leads | ○ No | ◐ Pair with your tracer |
See why “in the path” changes the outcome
- Tracers sit beside the call. They receive a copy after the model has already run and the money is already spent.
- Open Controller sits in the path. It checks who the agent is, what it may touch and how much budget it has left, before the call reaches the model or tool.
- When policy says no, the call is refused and logged. When it says yes, it runs and is traced.
Check what you get, in three layers
Trace
For agents built on Lyzr
- OpenTelemetry-standard telemetry
- Trace timeline waterfall with span durations
- Tokens and cost on every trace
- Average and P95 latency, error rate, reliability score
- Tool inputs, outputs and system messages logged
- Agent, user and model recorded on each trace
- Role-aware access: admins see all, users see their own
Cost
For agents built anywhere
- Which agents call which models, and where those models run
- Model and infrastructure spend by developer, project and agent
- Spend limits per agent, checked before the call
- One view across models, clouds and frameworks, without standardizing on any of them
- Flat annual fee, so tracing more never costs more
Control
For your whole agent system
- Discovers agents, including those in Salesforce, Snowflake, Databricks, ServiceNow and SAP
- Attributable identity and owner for every agent
- Refuses off-policy calls in the request path
- Stop, restrict or isolate an agent immediately
- Immutable versions; rollback is a pointer move
- Governs existing containerized agents with no rewrite
Cut LLM spend at the call, not on the invoice
- See it: cost per span, agent, developer and project shows the retry loop or oversized context behind the bill.
- Cap it: spend limits stop a runaway loop before the next model call, not at month end.
- Route it: seeing which agent uses which model shows where a cheaper model will do the job.
- Keep it flat: most tracers charge by traces, events or ingestion, so the bill rises as you instrument more. Open Controller’s flat fee removes that trade-off.
Pick it if you are
- A CTO or Head of AI who has to explain the LLM bill by team and agent
- An AI platform lead running agents across several frameworks, clouds and SaaS platforms
- A CISO who needs prompts and traces to stay in your environment
- Any leader whose agents touch customers, money or production data
Skip it for now if you are
- A single developer debugging one prototype with no production traffic
- A team that only needs a LangGraph trace viewer today. Start with LangSmith and add Open Controller when agents go to production
- Looking for a tool to build your containers. Your team keeps owning agent code and images
See who runs on Lyzr
- Published case studies include a leading energy provider, a global IT company, an HR and workforce leader, a customer service leader and an industrial manufacturer
- Industry focus: banking, insurance, healthcare, fintech and government
Pick Lyzr Open Controller when seeing the problem is no longer enough, and you need to own the cost, the data and the decision on every LLM call.
Talk to usCompare the other 10 tools
Each is strong at the job it was built for. Most are developer tools; several pair well with Lyzr Open Controller in production.
2. Langfuse: self-host open-source tracing
MIT-licensed tracing, prompt management and evals. Acquired by ClickHouse in January 2026; stays open source.
- Best for
- Teams that want full hosting control
- Traces live
- Your infrastructure, or Langfuse Cloud
- Scale
- 20,000+ GitHub stars by end of 2025; 2,000+ paying customers
- Close parity between self-hosted and cloud
- OpenTelemetry-based tracing
- Large, active community
- Spend limits and agent ownership are outside its scope; running it at scale means operating ClickHouse yourself
Right call for open-source tracing.Add Lyzr Open Controller to cap spend and control agents in production.
3. LangSmith: debug LangChain and LangGraph
Tracing, evals and prompt tools from the LangChain team, with OpenTelemetry support for code outside LangChain.
- Best for
- LangGraph-heavy engineering teams
- Traces live
- LangSmith cloud; self-host on enterprise tier
- Scale
- Built by LangChain, Inc.
- Deepest LangGraph execution trees
- Datasets and evals tied to traces
- Prompt playground and versioning
- Access is organized by project and workspace, not per-agent identity or spend
Right call for LangGraph developers.Add Lyzr Open Controller for cross-framework cost and control.
4. Arize Phoenix: trace on open standards
Open-source (Elastic License 2.0), OpenTelemetry and OpenInference native. Arize AX is the enterprise tier.
- Best for
- Teams committed to OpenTelemetry
- Traces live
- Your infrastructure, or Arize AX cloud
- Scale
- Established MLOps vendor behind it
- Portable, standards-based traces
- Strong evals and RAG diagnostics
- Covers classical ML through Arize AX
- Scale features such as advanced dashboards sit in the paid AX tier
Right call for standards-first teams.Add Lyzr Open Controller to enforce, not only observe.
5. Braintrust: turn traces into eval gates
Evaluation-first platform; production traces feed scoring, monitoring and CI regression tests.
- Best for
- Eval-driven product engineering
- Traces live
- Braintrust cloud; hybrid on enterprise plans
- Scale
- Customers include Notion and Stripe, per Braintrust
- Regressions caught before release
- Fast prompt and model comparison
- SDK and OpenTelemetry ingestion
- Answers whether output was right, not whether the agent was allowed to act
Right call when quality is the hardest problem.Add Lyzr Open Controller for permission and spend.
6. MLflow Tracing: stay inside your ML platform
Apache 2.0, Linux Foundation project backed by Databricks. Traces agent runs as a graph, with an AI Gateway for budgets.
- Best for
- Databricks and MLflow teams
- Traces live
- Your MLflow server, or Databricks
- Scale
- One of the most deployed open-source ML tools
- OpenTelemetry-compatible tracing
- Token and cost tracking
- Gateway budget policies for routed LLM traffic
- Agent-specific reasoning views are thinner than dedicated tracers
Right call if you live in Databricks.Add Lyzr Open Controller to govern agents beyond it.
7. W&B Weave: trace next to your experiments
LLM tracing and evals from Weights & Biases, now part of CoreWeave.
- Best for
- Teams already tracking models in W&B
- Traces live
- W&B cloud or dedicated deployment
- Scale
- Widely used ML experiment platform
- Traces and evals beside training runs
- Simple decorator-based instrumentation
- Familiar UI for ML teams
- Roadmap now follows CoreWeave’s broader AI cloud strategy
Right call for W&B-native teams.Add Lyzr Open Controller for production cost and control.
8. Comet Opik: start light with open source
Open-source tracing, LLM-as-judge evals and prompt optimization from Comet.
- Best for
- Teams wanting tracing plus evals quickly
- Traces live
- Your infrastructure, or Comet cloud
- Scale
- Backed by Comet
- Full trace trees for multi-step agents
- Built-in hallucination and RAG metrics
- Token usage dashboards
- Managed enterprise features sit in Comet’s paid platform
Right call for a light start.Add Lyzr Open Controller as agents reach regulated production.
9. OpenLLMetry: instrument once, send anywhere
Apache 2.0 OpenTelemetry instrumentation by Traceloop for LLMs, vector stores and frameworks.
- Best for
- Teams with an existing OTel backend
- Traces live
- Wherever you export them
- Status
- Traceloop reported acquired by ServiceNow, Mar 2026
- Vendor-neutral spans
- Works with Datadog, Honeycomb, Grafana and more
- Aligned with OTel GenAI conventions
- Instrumentation, not a product: you still need a backend and UI
Right call for portability.Pair with Lyzr Open Controller for enforcement.
10. Datadog LLM Observability: keep it in your APM
AI module that correlates LLM and agent spans with APM, logs and infrastructure. Dynatrace offers a similar extension.
- Best for
- Datadog-standardized platform teams
- Traces live
- Datadog’s cloud
- Scale
- Public company, large enterprise base
- No new vendor to onboard
- LLM spans next to infrastructure metrics
- Reuses existing alerting
- Ingestion pricing grows with agent traffic; agent reasoning depth is lighter
Right call for consolidation.Add Lyzr Open Controller when alerts need to become limits.
11. Splunk Agent Observability: add evals to Splunk
Formerly Galileo. Cisco completed the acquisition in May 2026 and renamed the product in August 2026.
- Best for
- Splunk and Cisco security shops
- Traces live
- Splunk’s cloud
- Scale
- Reported customers include Comcast, HP and NTT
- Low-latency evaluation models
- Real-time guardrails
- Telemetry beside security data
- Pricing and roadmap now follow the Splunk portfolio
Right call inside Splunk.Consider Lyzr Open Controller for a neutral layer in your cloud.
Compare all 11 tools side by side
● Strong ◐ Partial ○ Not the focus. Editorial assessment, September 2026. Verify against current vendor documentation before you buy.
| Tool | Best for | Where traces live | OpenTelemetry | Cost attribution | Spend limits enforced | Stops a bad call first | Pricing model | 2026 ownership |
|---|---|---|---|---|---|---|---|---|
| Lyzr Open Controller | Enterprise tracing, cost and control | ● Your cloud, on-prem, air-gapped | ● | ● Agent, developer, project, model | ● Before the call | ● In the request path | Flat annual fee, unlimited | Independent |
| Langfuse | Open-source self-hosted tracing | ● Self-host or cloud | ● | ● | ○ | ○ | Open-source self-host, usage-based cloud | ClickHouse |
| LangSmith | LangChain and LangGraph | ◐ Self-host on enterprise | ◐ | ● | ○ | ○ | Seats plus traces | Independent |
| Arize Phoenix | OpenTelemetry-first teams | ● Self-host or AX | ● | ● | ○ | ○ | Open source, AX enterprise | Independent |
| Braintrust | Eval-driven development | ◐ Hybrid on enterprise | ◐ | ● | ○ | ○ | Usage-based | Independent |
| MLflow Tracing | Databricks and MLflow teams | ● Self-host or Databricks | ● | ● | ◐ Gateway budgets | ○ | Open source, Databricks managed | Linux Foundation |
| W&B Weave | W&B-native ML teams | ◐ Cloud or dedicated | ◐ | ● | ○ | ○ | Seats and usage | CoreWeave |
| Comet Opik | Light open-source tracing and evals | ● Self-host or cloud | ● | ● | ○ | ○ | Open source, Comet plans | Independent |
| OpenLLMetry | Vendor-neutral instrumentation | ● Any backend you choose | ● | ◐ Depends on backend | ○ | ○ | Open-source SDK | ServiceNow (reported) |
| Datadog LLM Observability | Datadog shops | ○ Vendor cloud | ● | ● | ○ | ○ | Ingestion and hosts | Public company |
| Splunk Agent Observability | Splunk and Cisco shops | ○ Vendor cloud | ● | ● | ○ | ◐ Guardrails | Splunk licensing | Cisco |
Pick by what your agents can touch
Cut LLM cost with tracing in five steps
- Tag every callAttach agent, user, project and model to each span, so every dollar has an owner.
- Rank spans by costSort by tokens and dollars. A few spans usually drive most of the bill.
- Hunt the usual suspectsRetry loops, oversized context, repeated retrieval and verbose system prompts.
- Test cheaper models on real tracesReplay traced requests against smaller models and keep the switch only where eval scores hold.
- Enforce budgets at the callSet spend limits per agent so the next runaway loop stops itself. This is where Lyzr Open Controller does the work a tracer cannot.
Run these five tests in every vendor demo
- The retry test. Force a stale tool result and ask them to show the retry loop and its exact cost.
- The bill test. Ask for last month’s spend split by agent, developer and model, and your price at ten times today’s volume, in writing.
- The cap test. Ask them to stop an agent that exceeds its budget, live, before the next model call.
- The residency test. Ask exactly where prompts and traces are stored, and who can read them.
- The exit test. Export a week of traces in OpenTelemetry format and ask what happens to the roadmap if the vendor is acquired.
Get answers to common questions
What is LLM tracing?
LLM tracing records every step inside one LLM or agent request: prompts, model calls, retrievals, tool calls, tokens, cost and latency. Each step is a span, and nested spans form a trace tree you replay to find what went wrong.
What is the difference between LLM tracing and logging?
A log records that a request happened and how it ended. A trace records the path in between, including what each step retrieved, called and cost.
What is the difference between LLM tracing and LLM observability?
Tracing is one technique inside observability. Observability combines traces, metrics and evaluation scores to understand and improve the system over time.
Can LLM tracing reduce AI costs?
Tracing finds what drives spend, such as retry loops or oversized context. Cutting the bill also takes action: switching models where quality holds and enforcing spend limits at the call, which Lyzr Open Controller does.
What is the best LLM tracing and debugging tool in 2026?
For enterprises whose agents touch customers, money or production data, Lyzr Open Controller. For developer debugging alone, Langfuse and LangSmith; for evaluation-first teams, Braintrust.
Which LLM tracing tools are open source?
Langfuse, Arize Phoenix, MLflow, Comet Opik and OpenLLMetry.
Where are LLM traces stored, and why does it matter?
Traces hold full prompts, completions and tool inputs, often including customer data and business logic. SaaS tools store them in the vendor’s cloud unless you buy a self-hosted tier; Lyzr Open Controller runs in your own cloud or on-prem, including air-gapped.
What is OpenTelemetry for LLMs?
The open standard for traces, metrics and logs. Its GenAI conventions let traces move between tools without re-instrumenting your code.
How is Lyzr Open Controller different from Langfuse or LangSmith?
They receive a copy of each call after it runs. Open Controller sits in the request path, so it can also check identity, spend and policy first and refuse the call. Many teams keep their tracer and add Open Controller for production.
How is Lyzr Open Controller priced?
A fixed annual fee covering unlimited agents, users, logs and usage.
Book A Demo: Click Here
Join our Slack: Click Here
Link to our GitHub: Click Here