An LLM response can fail for many reasons: a bad prompt, the wrong retrieved document, a slow model call, an unexpected tool call, a routing change, or an intermediate step nobody saw. The final answer rarely says which. Tracing records each step of a specific execution, so engineers can reconstruct what happened and debug from evidence instead of guesswork.
This guide compares the best tools for LLM tracing and debugging in 2026, weighing architecture, privacy, open-source and self-hosting needs, and production complexity.
TL;DR
- Lyzr Opencontroller: Best for enterprises that need identity, evaluation and governance around agent runtime activity.
- LangSmith: Best for LangChain and LangGraph teams.
- Langfuse: Best for open-source, self-hosted tracing with prompt management.
- MLflow: Best for teams already running MLflow.
- Arize Phoenix or OpenLLMetry: Best for OpenTelemetry-native, vendor-neutral tracing.
- W&B Weave: Best for teams already on Weights & Biases.
What Is LLM Tracing and Debugging?
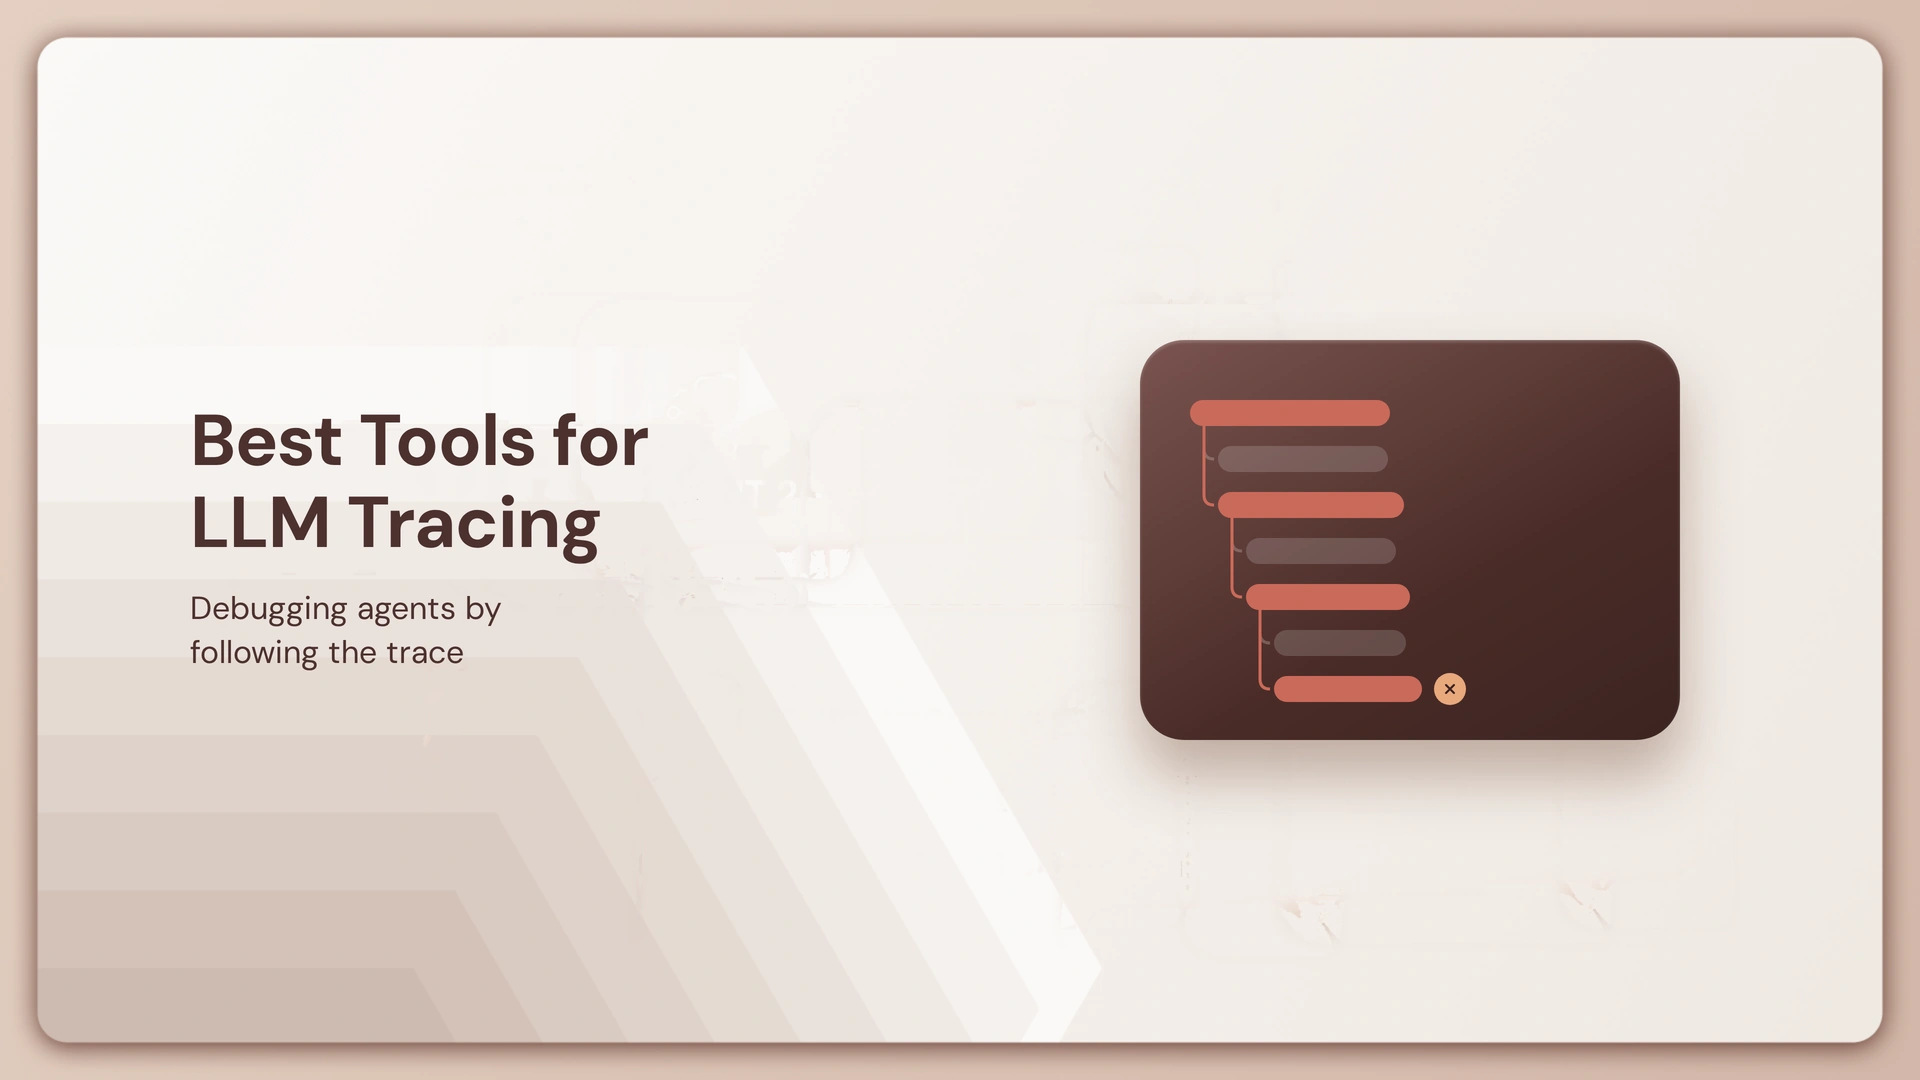
LLM tracing captures the path of one request as a tree of spans: prompts, retrieval, model calls, tool calls, latency, tokens, cost, errors and intermediate outputs. Debugging is the next step: using that trace to find and fix the cause of a failure.
What to Look For
- End-to-end and agent/tool tracing: Can it show retrieval, tool calls and multi-step workflows?
- Prompt and version tracking: Can you tie a failure to a prompt change?
- Token, cost, latency and error visibility
- Evaluation integration: Can you score traces?
- OpenTelemetry/OpenInference support: Is telemetry portable?
- Self-hosting and data controls: Where do prompts and outputs live?
- Production debugging: Can you filter, replay and compare traces?
How the Tools Compare
| Tool | Best for | Tracing | Agent/tool tracing | Evals | Cost tracking | Open source/self-host | OpenTelemetry |
| Lyzr Opencontroller | Enterprise control | Runtime activity | Agent-level | ✓ | ✓ | Runs in your environment | — |
| LangSmith | LangChain teams | ✓ | ✓ | ✓ | ✓ | Partial | ✓ |
| Langfuse | Self-hosted tracing | ✓ | ✓ | ✓ | ✓ | ✓ | ✓ |
| MLflow | MLflow users | ✓ | ✓ | ✓ | ✓ | ✓ | ✓ |
| W&B Weave | W&B users | ✓ | ✓ | ✓ | ✓ | Partial | ✓ |
| Arize Phoenix | OTel-native debugging | ✓ | ✓ | ✓ | ✓ | ✓ | ✓ |
| OpenLLMetry | Instrumentation | ✓ | ✓ | Via Traceloop | Tokens | ✓ | ✓ |
The Best Tools for LLM Tracing and Debugging
1. Lyzr Opencontroller
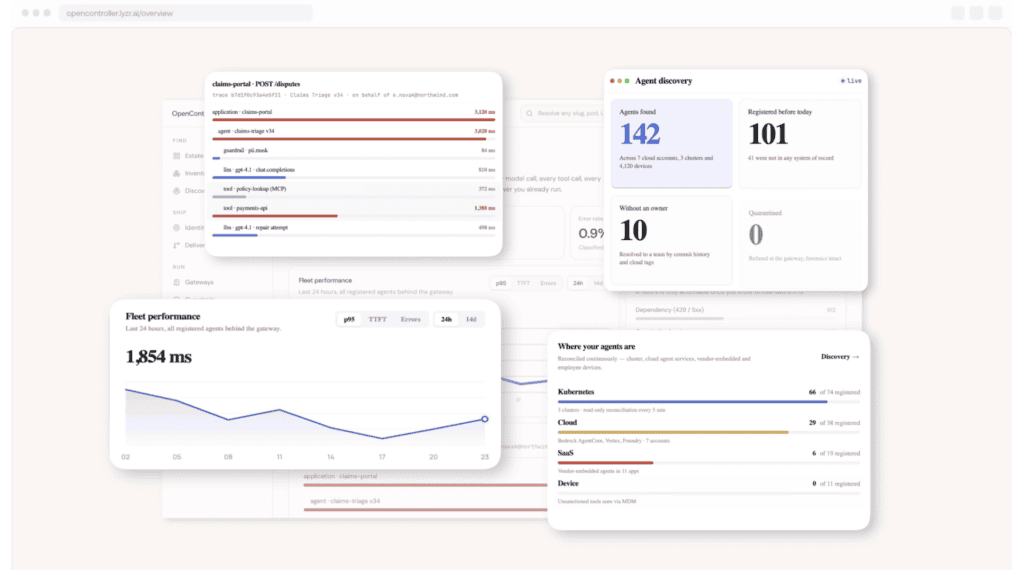
Opencontroller is not a tracing SDK. It is the control layer above the runtimes where agents already run, adding identity, evaluation gates, spend limits and runtime visibility around the traces your existing tools capture. Agents built in Lyzr Agent Studio also get built-in monitoring and tracing on OpenTelemetry.
Key features
- Agent registry and identity
- Runtime activity and spend visibility
- Evaluation gates before promotion
- Policy enforcement and audit trail
Strengths
- Context around every trace
- Works above existing tracing tools
- Cross-framework, cross-cloud
Weaknesses
- Not a span-level debugger
- Commercial, not open source
- Overkill for one application
Best for: Enterprises whose agent estate spans teams, frameworks and clouds. Pair it with AI agent tracing tools for span-level debugging.
2. LangSmith
LangSmith is framework-native tracing for LangChain and LangGraph, combining debugging, datasets and evaluation, and it accepts non-LangChain apps too.
Key features
- Nested run traces
- Agent and tool tracing
- Online evaluation
- Cost and latency dashboards
Strengths
- Deep LangGraph debugging
- Evals beside traces
- Mature ecosystem
Weaknesses
- Best inside LangChain
- Weaker for self-hosted stacks
- Heavy for basic tracing
Best for: Teams building on LangChain or LangGraph.
3. Langfuse

Langfuse is open-source (MIT) LLM observability covering tracing, prompt management, datasets and evaluation, now part of ClickHouse. Self-hosting keeps prompts and outputs in your environment.
Key features
- Self-hostable traces
- Prompt versioning
- Token and cost tracking
- OpenTelemetry-based
Strengths
- Data control
- Broad framework support
- Tracing plus prompts
Weaknesses
- You operate the infrastructure
- Alerts are Cloud-only
- Narrow governance
Best for: Teams wanting open-source, self-hosted tracing.
4. MLflow

MLflow Tracing is OpenTelemetry-compatible and open source, adding traces to the experiment-tracking platform many ML teams already run.
Key features
- Autologging for agent frameworks
- Token and cost tracking
- Evaluation scorers
- Self-hosted tracking server
Strengths
- Free and open source
- Fits existing MLflow stacks
- Data on your infrastructure
Weaknesses
- Tracking server isn’t built for hyper-scale traffic
- Less debugging-specific UX
- Broader platform overhead
Best for: ML teams already standardized on MLflow.
5. W&B Weave

Weave adds tracing, evaluation and an agents view to Weights & Biases, and accepts OpenTelemetry spans through a dedicated OTLP endpoint.
Key features
- Agent traces
- OTLP ingestion
- Cost tracking
- Online evals (preview)
Strengths
- Familiar to W&B users
- Rich trace views
- Standards-based ingestion
Weaknesses
- Best with a W&B footprint
- Online evals still in preview
- Self-hosting less central
Best for: ML teams already using Weights & Biases.
6. Arize Phoenix

Phoenix is OpenTelemetry- and OpenInference-native tracing with evaluation. It runs in a notebook or self-hosted; alerting sits in Arize AX.
Key features
- OpenInference tracing
- RAG debugging
- Built-in evaluators
- Local or self-hosted
Strengths
- Fast local debugging
- Vendor-neutral
- Free to run
Weaknesses
- Elastic License 2.0, not OSI open source
- Alerting requires AX
- You run operations
Best for: Engineers debugging RAG and agents with standards-based telemetry.
7. OpenLLMetry

OpenLLMetry is Apache 2.0 instrumentation that extends OpenTelemetry to LLM providers, vector databases and frameworks. Its steward, Traceloop, is joining ServiceNow; the project remains open source.
Key features
- Auto-instrumentation
- Multi-language SDKs
- Standard OpenTelemetry export
- LangChain and CrewAI support
Strengths
- No vendor lock-in
- Works with Datadog, Honeycomb
- Lightweight
Weaknesses
- Needs a separate backend
- Evaluation lives elsewhere
- Stewardship shifting to ServiceNow
Best for: Platform teams standardizing on OpenTelemetry.
A note on Helicone: Mintlify acquired Helicone in March 2026 and it is in maintenance mode, so it is not recommended for new deployments. Langfuse publishes a migration guide.
How to Choose
- On LangChain or LangGraph? LangSmith.
- Need self-hosting or privacy control? Langfuse or Phoenix; see Lyzr’s open-source LLM observability platforms guide.
- Standardizing on OpenTelemetry? OpenLLMetry or Phoenix.
- Already on MLflow or W&B? Stay in that ecosystem.
- Using a gateway or multi-model routing? Trace at the application layer as well, since gateways see requests, not application logic.
- Need enterprise governance? Add Opencontroller above your tracing tool.
LLM Tracing vs Observability vs Monitoring
| Concept | Question it answers |
| Tracing | What happened in this execution? |
| Debugging | Why did it fail, and how do we fix it? |
| Observability | What is the system doing, judged from its telemetry? |
| Monitoring | Are known metrics within thresholds? |
Monitoring tells you something broke; tracing shows where. For the wider category, see AI agent observability.
How LLM Tracing Fits Into Production AI
The lifecycle runs Build → Instrument → Trace → Evaluate → Deploy → Monitor → Debug → Improve. Traces are far more useful when connected to agent versions, identity, AI agent evaluation results, deployment history and runtime activity, because a failing span then answers who ran which version, and whether it passed its gate.
The best tools for LLM tracing and debugging show what happened. Opencontroller supplies the surrounding context. It sits above your tracing tools as an AI control plane, connecting runtime visibility to identity, evaluation and AI agent governance. Keep Langfuse or LangSmith for traces; add OpenController for the fleet. Lyzr’s production playbook covers the rollout.
See how Opencontroller connects these layers across your agent estate, or book a demo to see how it fits into your stack.
FAQs
LLM tracing records each step of one execution, including prompts, retrieval, model calls, tool calls, latency, tokens and errors, so you can reconstruct exactly what happened.
LangSmith, Langfuse, MLflow, W&B Weave, Arize Phoenix and OpenLLMetry cover span-level tracing. The right pick depends on your framework, hosting and privacy needs. Opencontroller adds identity, evaluation and governance around whichever tool you choose.
Langfuse (MIT), MLflow, Arize Phoenix (Elastic License 2.0) and OpenLLMetry (Apache 2.0) are the leading open-source options.
Yes. Langfuse’s core is MIT-licensed and self-hostable. It is now part of ClickHouse, and its alert monitors are Cloud-only.
Tracing reconstructs one execution. Observability is the broader ability to understand system behavior from telemetry, including traces, metrics and logs.
Monitoring checks known metrics against thresholds. Observability lets you investigate unknown failures using detailed telemetry.
Trace the failing request, inspect each span’s inputs and outputs, isolate the faulty step, then fix it and rerun against an evaluation set to confirm the failure is gone and nothing else regressed.
It is the standard for exporting LLM traces in a vendor-neutral format. OpenLLMetry and OpenInference add LLM-specific instrumentation.
Helicone is in maintenance mode after Mintlify’s March 2026 acquisition, so new projects should choose an actively developed alternative.
Not necessarily. Datadog can ingest OpenTelemetry traces and may be enough for infrastructure-centric teams, but dedicated tools add prompt versioning, dataset workflows and deeper evaluation.
Book A Demo: Click Here
Join our Slack: Click Here
Link to our GitHub: Click Here