Most enterprises have a new AI agent problem.
It is not that they have too few agents.
It is that nobody is sure which ones are still worth running.
An agent can be technically healthy, have a named owner, pass its evaluations, and still be a bad use of infrastructure. It may have 12 users. It may complete 40 tasks a month. It may cost more to operate than the process it automates. Or it may have become redundant after another agent took over the same workflow.
That creates a portfolio problem.
As AI adoption grows, enterprises need to measure more than how many agents they have deployed. They need to know which agents are being used, which are delivering value, which are accumulating risk, and which should be retired.
This is where AI agent adoption metrics become useful.
The right metrics do not simply tell you whether an agent is popular. They tell you whether the agent still deserves to exist.
The problem with measuring AI adoption by agent count

Agent count is an easy metric to report.
“We deployed 150 AI agents this year.”
It sounds like progress.
But it tells you almost nothing about whether those 150 agents are actually contributing to the business.
Consider two portfolios:
| Metric | Portfolio A | Portfolio B |
| Agents deployed | 150 | 80 |
| Monthly active agents | 52 | 68 |
| Agents with <10 monthly runs | 61 | 4 |
| Agents with declining usage | 34 | 7 |
| Agents with duplicate capabilities | 28 | 3 |
| Average task success rate | 82% | 94% |
| Agents with measurable business owner | 71% | 98% |
| Agents exceeding cost threshold | 19 | 2 |
Portfolio A has almost twice as many agents.
Portfolio B is probably the healthier AI estate.
That distinction becomes important as organizations move from experimentation to operating AI agents at scale. Lyzr describes agent sprawl as the situation where more agents are running than anyone has properly counted, with insufficient ownership and governance around them.
So the first shift is simple:
Stop asking, “How many agents have we deployed?”
Start asking:
“What evidence tells us each deployed agent should still be running?”
What AI agent adoption metrics should actually measure
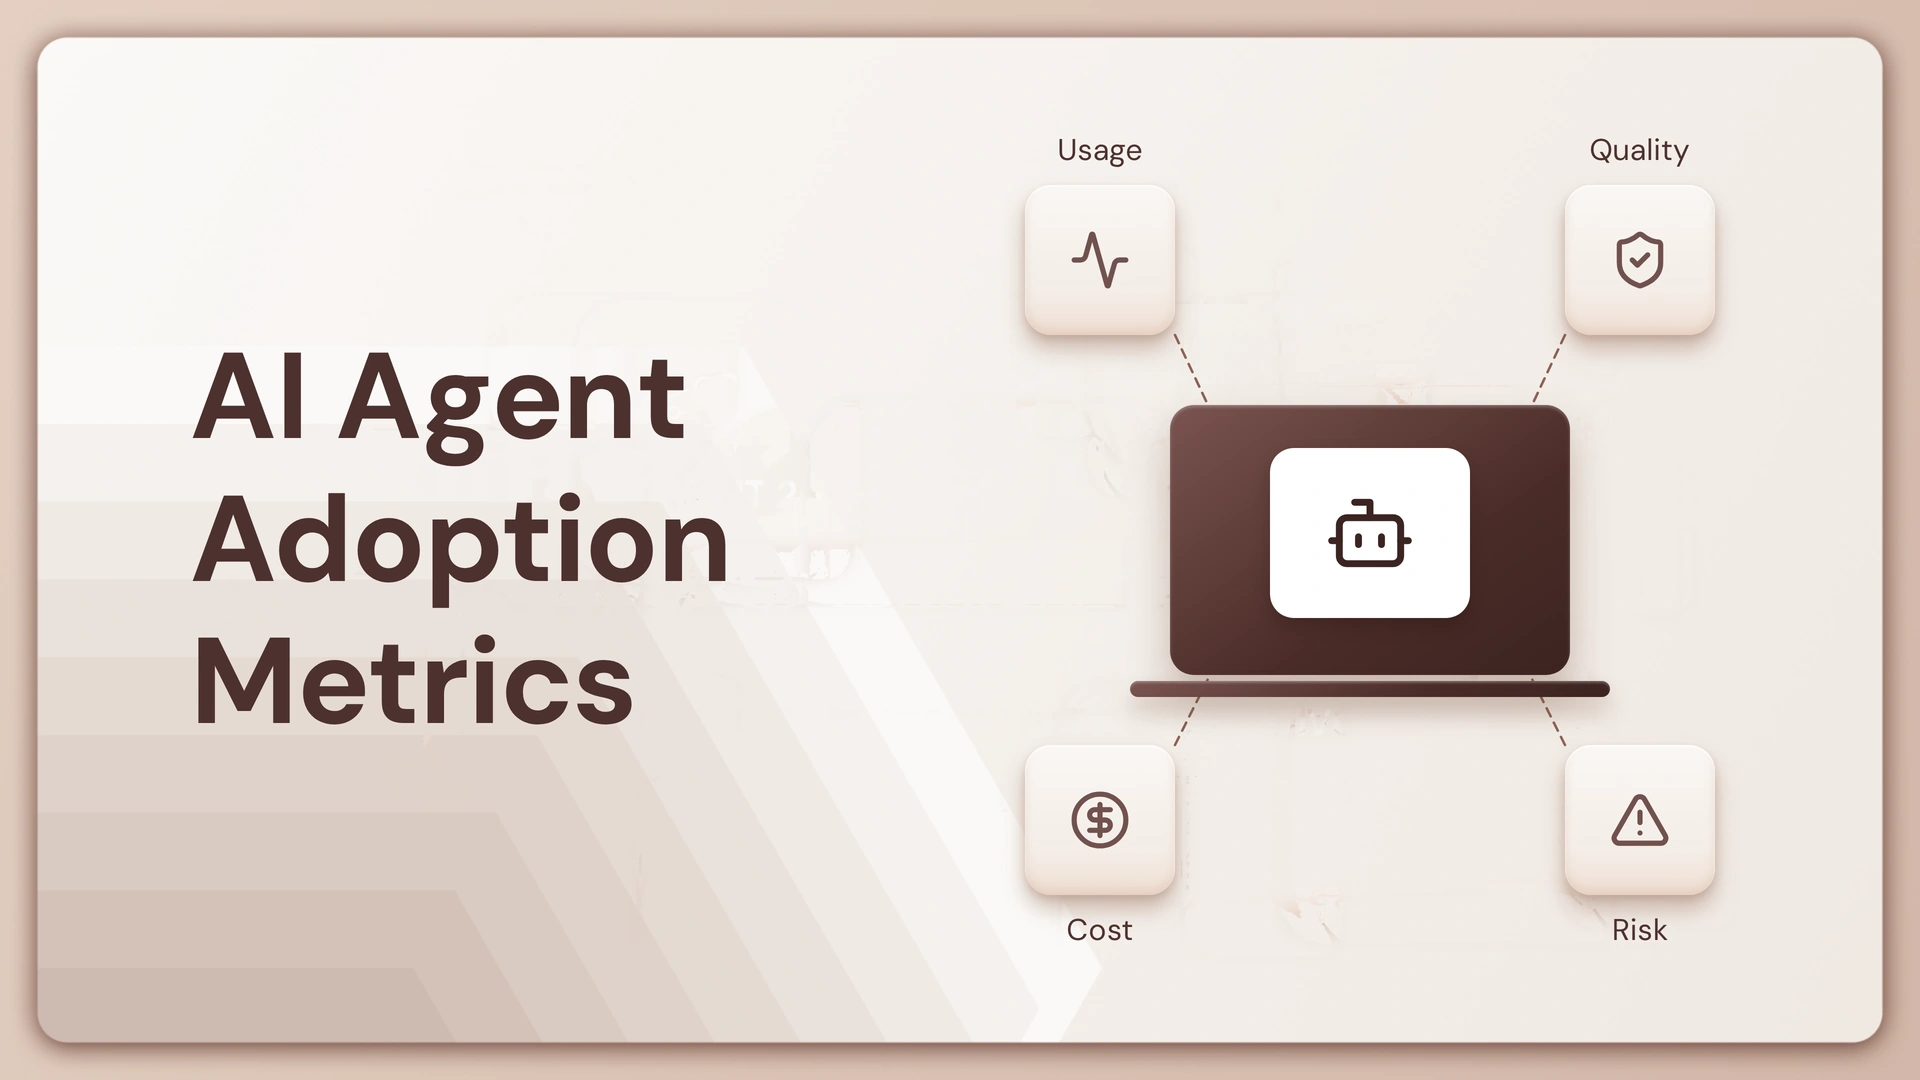
A useful adoption framework needs to connect five things:
- Usage — Is anyone using the agent?
- Value — Is the agent completing meaningful work?
- Quality — Is it completing that work reliably?
- Efficiency — Is the value worth the compute and operational cost?
- Risk — Is the agent still appropriate to operate with its current permissions and behavior?
These dimensions should not be evaluated independently.
An agent with low usage may be worth keeping if it handles a high-value process that only runs 20 times a month.
An agent with thousands of runs may need retirement if those runs are low-value, expensive, or increasingly handled by another system.
That means there is no single “retire if usage < X” threshold.
Instead, teams need a portfolio-level retirement framework.
1. Start with utilization, but don’t stop there
The most obvious adoption metric is utilization.
At minimum, track:
- Monthly active users
- Monthly active runs
- Tasks completed
- Repeat users
- Unique workflows triggered
- Usage trend over time
- Percentage of deployed capacity actually being used
A basic utilization view might look like this:
| Agent | Monthly Runs | Active Users | 90-Day Trend | Initial Signal |
| Contract Review Agent | 8,420 | 186 | +22% | Growing |
| Sales Research Agent | 3,180 | 74 | +8% | Healthy |
| Internal FAQ Agent | 420 | 31 | -18% | Watch |
| Legacy Reporting Agent | 48 | 6 | -71% | Retirement candidate |
| Claims Triage Agent | 12,600 | 94 | +31% | Strategic |
The important metric here is trend, not just volume.
An agent doing 400 runs today might be healthier than one doing 4,000 runs if usage is growing quickly.
Conversely, an agent that dropped from 20,000 runs to 2,000 over six months is sending a much stronger retirement signal.
A useful utilization rule
Don’t ask:
“Is this agent being used?”
Ask:
“Is usage stable, growing, declining, or disappearing?”
That turns a static adoption number into a lifecycle signal.
2. Measure task completion, not just activity
Usage can be misleading.
An agent can generate thousands of runs because users repeatedly retry failed requests.
That is why task completion rate needs to sit next to usage.
For example:
| Agent | Runs | Successful Tasks | Task Completion Rate |
| Agent A | 10,000 | 9,300 | 93% |
| Agent B | 10,000 | 5,800 | 58% |
| Agent C | 1,200 | 1,140 | 95% |
Agent B appears highly adopted.
It may actually be the weakest agent in the portfolio.
If users have to retry prompts, manually correct outputs, or complete the workflow themselves, the run count is inflating the perceived value.
Lyzr’s agent evaluation capabilities include metrics such as task completion, hallucination, faithfulness, reflection, tool-call accuracy, and knowledge-base retrieval precision.
That distinction matters because adoption without successful completion is activity, not value.
And once you start measuring successful work instead of raw activity, cost becomes the next obvious question.
3. Put cost beside usage
An agent can be popular and still be economically inefficient.
Track metrics such as:
- Cost per run
- Cost per completed task
- Token consumption
- Infrastructure cost
- Tool/API costs
- Human intervention cost
- Cost trend over time
The most useful metric is usually:
Cost per successful task
For example:
| Agent | Monthly Cost | Successful Tasks | Cost / Successful Task |
| Agent A | $2,400 | 8,000 | $0.30 |
| Agent B | $5,800 | 4,000 | $1.45 |
| Agent C | $900 | 1,500 | $0.60 |
| Agent D | $7,200 | 1,200 | $6.00 |
Agent D should immediately trigger a review.
But even this metric needs context.
If Agent D automates a process that previously required $40 of human effort per transaction, $6 may be excellent.
If Agent B replaces a process that costs $0.80 manually, $1.45 may be difficult to justify.
So the retirement question becomes:
Is this agent generating enough economic value to justify its operating cost?
4. Track human intervention as a hidden adoption metric
One of the easiest ways to overestimate an agent’s success is to ignore the human work happening after the agent finishes.
Suppose an invoice-processing agent reports:
- 95% successful runs
- 8,000 monthly tasks
- 98% uptime
That sounds excellent.
But if 35% of those outputs require manual correction, the real automation rate is much lower.
Track:
| Metric | What it reveals |
| Human takeover rate | How often people must finish the job |
| Correction rate | How often outputs need editing |
| Escalation rate | How frequently work is handed to humans |
| Rework rate | How often a task has to be repeated |
| Approval rate | Whether outputs can be trusted without intervention |
| Average human handling time | How much manual work remains |
This creates a more useful metric:
Net automation rate
Net automation rate = tasks completed without human intervention ÷ total eligible tasks
That is much closer to business value than raw agent activity.
An agent completing 10,000 tasks with 40% human intervention may deliver less automation than one completing 4,000 tasks with 95% autonomy.
5. Measure quality decay over time
An agent should not earn permanent production status because it performed well during its launch period.
Its environment changes.
Models change. Prompts change. Knowledge bases change. Tools change. User behavior changes. Business rules change.
That makes quality trend one of the most important adoption metrics.
Track:
- Task success rate
- Evaluation score
- Hallucination rate
- Groundedness
- Tool-call accuracy
- Retrieval precision
- Policy violations
- Error rate
- Regression frequency
Lyzr’s evaluation framework covers several of these dimensions, including task completion, hallucination, faithfulness, tool-call accuracy, and retrieval precision.
The important question is not:
“Did the agent pass evaluation?”
It is:
“Is the agent still passing the same quality bar it passed when we approved it?”
A simple trend can reveal the difference:
| Agent | Launch Score | Current Score | Change | Decision Signal |
| A | 94% | 95% | +1% | Keep |
| B | 91% | 88% | -3% | Monitor |
| C | 93% | 76% | -17% | Remediate / review |
| D | 87% | 61% | -26% | Retirement candidate |
This is where adoption metrics start becoming lifecycle metrics.
6. Look for agents that have become redundant
Low usage is not always the reason to retire an agent.
Sometimes the problem is duplication.
Three teams may have built separate agents for:
- Document summarization
- Sales research
- Customer-ticket classification
- Internal knowledge search
- Compliance review
Individually, each agent might look healthy.
Together, they may represent unnecessary duplication.
A portfolio review should therefore track:
| Duplication Signal | Question to Ask |
| Same workflow | Are multiple agents solving the same business problem? |
| Same data | Are several agents using the same knowledge sources? |
| Same tools | Are they calling the same APIs? |
| Same users | Are the same teams using multiple agents? |
| Similar outputs | Could one agent replace several? |
| Different owners | Is duplication happening because teams cannot see each other’s agents? |
This is one reason agent inventory matters.
A registry can tell you that agents exist. But inventory alone does not solve the problem.
The next question is whether you can connect inventory → usage → performance → ownership → lifecycle decisions.
That is where a control plane becomes much more useful than a static list.
7. Add risk to the retirement score
An agent with low usage and low risk can probably be scheduled for a normal retirement process.
An agent with low usage and high privilege is different.
Consider two agents:
| Metric | Agent A | Agent B |
| Monthly runs | 120 | 3,400 |
| Active users | 8 | 120 |
| Task success | 94% | 91% |
| Monthly cost | $300 | $4,500 |
| System access | Read-only | Write access |
| Sensitive data | No | Yes |
| Policy violations | 0 | 3 |
| Owner | Named | Named |
Agent A looks like a low-priority cleanup candidate.
Agent B is heavily used, but its risk profile deserves immediate attention.
This is why retirement decisions cannot be based on adoption alone.
Track:
- Permission scope
- Sensitive data access
- Number of connected tools
- Unexpected tool calls
- Policy violations
- Authentication method
- Last security review
- Owner status
- Auditability
- Runtime behavior
Lyzr’s research on AI agent security highlights the need for access control, governance, human oversight, observability, and auditability as agents become capable of acting across enterprise systems.
The result is a much more useful principle:
Low adoption makes an agent a cleanup candidate. Low adoption plus high risk makes it a governance priority.
The AI agent retirement scorecard
Once these metrics exist, teams can stop debating individual agents based on anecdotes.
A practical retirement score can combine five dimensions.
| Dimension | Weight | What to Measure |
| Adoption | 20% | Active users, run frequency, usage trend |
| Business value | 25% | Successful tasks, time saved, workflow impact |
| Quality | 20% | Task success, eval score, errors, regressions |
| Efficiency | 15% | Cost per successful task, human intervention |
| Risk | 20% | Permissions, violations, sensitive data, ownership |
Score each dimension from 1 to 5.
Example
| Agent | Adoption | Value | Quality | Efficiency | Risk | Overall |
| Contract Agent | 5 | 5 | 5 | 4 | 4 | 4.7 |
| Research Agent | 4 | 4 | 4 | 4 | 4 | 4.0 |
| FAQ Agent | 2 | 3 | 3 | 3 | 4 | 3.0 |
| Legacy Report Agent | 1 | 1 | 2 | 2 | 3 | 1.8 |
This does not mean every agent below a specific score should automatically disappear.
Instead, use the score to determine the next action.
| Score | Recommended action |
| 4.0–5.0 | Keep and scale |
| 3.0–3.9 | Monitor and improve |
| 2.0–2.9 | Formal review |
| <2.0 | Retirement candidate |
The important word is candidate.
Retirement should still account for strategic importance, contractual requirements, business continuity, and dependencies.
Where OpenController fits into the retirement decision
This is where the difference between an agent registry and an active control plane matters.
A registry can tell you:
“These 147 agents exist.”
A useful control layer needs to help answer:
“Where are they running, who owns them, what are they doing, how are they performing, and what should happen next?”
Lyzr OpenController is designed around that broader lifecycle.
Its Find capability discovers agents, models, tools, data, and workflows across an AI estate. Ship evaluates and governs agents before production. Run monitors agents, applications, APIs, and infrastructure at runtime. Improve turns usage, performance, cost, and security signals into actionable insights.
That makes it particularly relevant to retirement decisions.
Instead of maintaining a spreadsheet that says:
| Agent | Owner | Status |
| Contract Agent | Legal | Active |
| Research Agent | Sales | Active |
| FAQ Agent | Support | Active |
| Reporting Agent | Finance | Active |
you want the lifecycle data around those agents to answer:
| Retirement question | Signal needed |
| Is anyone using it? | Usage trend |
| Is it doing useful work? | Task completion |
| Is it still performing? | Evaluation / quality |
| Is it expensive? | Cost per successful task |
| Is it duplicating another agent? | Capability / workflow inventory |
| Is it creating unnecessary risk? | Permissions / policy activity |
| Who owns the decision? | Agent identity + ownership |
| Can we safely shut it down? | Dependencies + runtime controls |
That is the difference between inventory management and agent lifecycle management.
Book A Demo: Click Here
Join our Slack: Click Here
Link to our GitHub: Click Here