Picture this: your support agent takes 18 seconds to answer a question that should take 3. Someone on your team opens the logs and finds exactly one line: request completed in 18.2s. That’s it. No idea if the model was slow, if a tool call hung, or if the agent quietly retried something twice before giving up and moving on.
That’s the situation most teams are in without proper tracing, and it’s exactly what OpenTelemetry fixes. It breaks that one vague number into the individual steps that made it up, so instead of guessing, you can point at the exact moment things slowed down or went wrong.
The problem with normal logs
A regular app has a short, predictable path: request in, database call, response out. If it’s slow, there are maybe two or three usual suspects.
An agent has a longer, messier path. A single request might touch a model, a couple of tools, a retrieval step, and another model call, sometimes with a retry mixed in, before it produces an answer. Here’s what that 18 second request actually looked like once it was traced:
| Step | Time spent |
|---|---|
| Waiting on a third-party API | 11.0s |
| Model generating the response | 4.2s |
| Retrieving context | 2.1s |
| Everything else | 0.9s |
Once you can see that breakdown, “make the agent faster” turns into “go find out why that API call takes 11 seconds,” which is a problem someone can actually own and fix.
What changes once you can see the steps
| Without tracing | With tracing |
|---|---|
| “The agent failed.” | “The second tool call returned a 401 at 14:32.” |
| “Costs went up.” | “This workflow jumped from 4 model calls to 7.” |
| “The answer was wrong.” | “Retrieval returned 2 irrelevant documents before generation.” |
| “It’s unreliable.” | “80% of failures trace back to one tool.” |
Every row on the right is something you can act on. Every row on the left is something you’d have to investigate from scratch.
How OpenTelemetry organizes an agent’s story
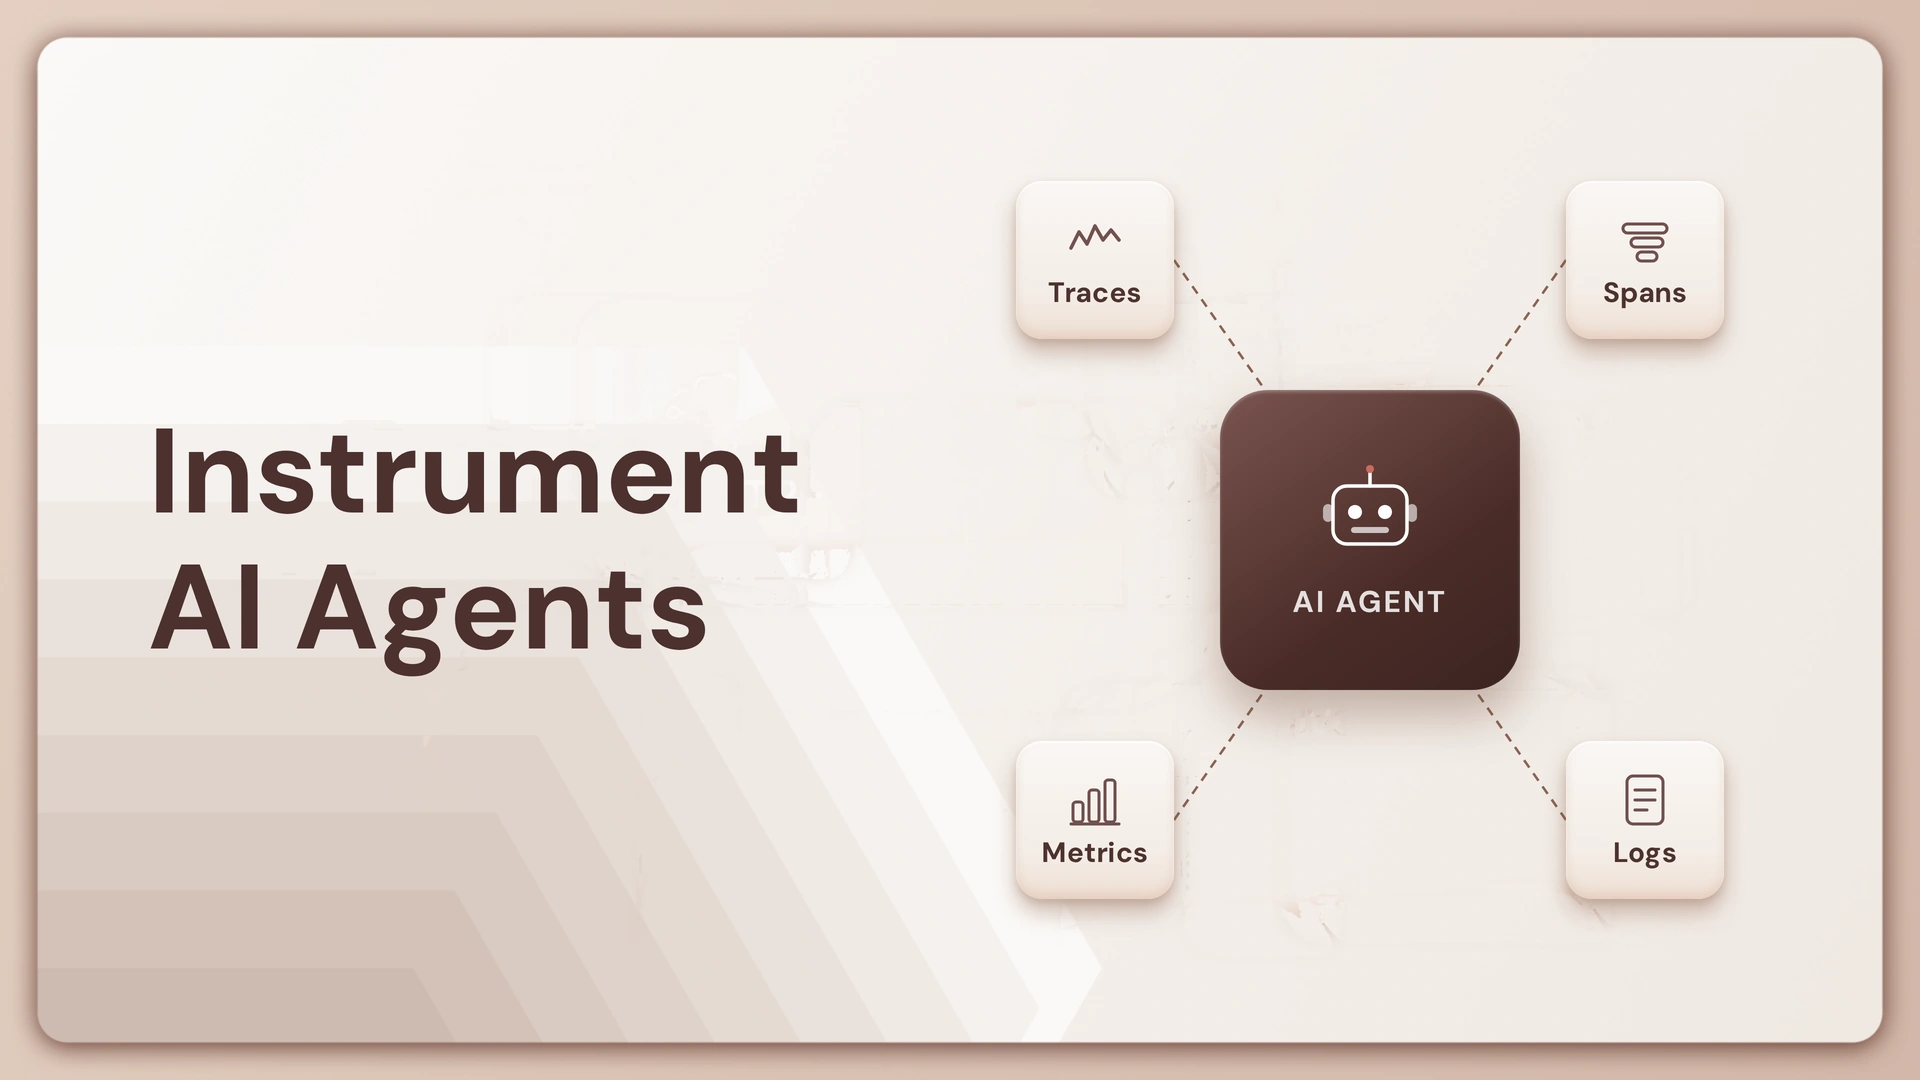
Every agent run becomes one trace, a single record of that request from start to finish. Inside it, each meaningful step gets its own smaller entry, called a span, nested inside the bigger one. A typical agent request might generate anywhere from 5 to 15 of these, depending on how many tools and model calls it needs.
| Step in the run | What gets recorded |
|---|---|
| The overall agent run | Agent name, version, status |
| Each model call | Model used, tokens in/out, latency |
| Each tool call | Tool name, success or failure, duration |
| Retrieval | Source, number of results, time taken |
| Errors | What failed, and where |
What’s worth capturing
Five things cover most of what you’ll need: which model was used, roughly how many tokens it consumed, how long each step took, whether each tool call succeeded, and which version of the agent handled the request. If a teammate asks “why did this fail” or “why did this get more expensive,” those five details are usually enough to answer both.
What to leave out by default
The actual prompt and response text can carry customer data or credentials, so it deserves more caution than a duration number does. A safer default is to record what happened and how long it took, and only store the full content when you’ve made a deliberate call that it’s safe to do so.
Can you actually debug from your own traces?
Here’s a quick way to find out. Pull up one recent trace from your own system and see how many of these you can answer without opening anything else:
- [ ] Can you tell which agent and version handled this request?
- [ ] Can you see every model call it made?
- [ ] Can you see every tool it called, and whether each one succeeded?
- [ ] Can you tell how many tokens it used?
- [ ] Can you point to the single slowest step?
- [ ] If it failed, can you tell exactly which step failed and why?
If you checked 5 or 6, your tracing is in good shape. If you’re at 3 or fewer, that’s a sign your spans need more detail, or you’re missing a step entirely, most often retrieval or tool calls.
Common mistakes and quick fixes
| Mistake | Why it hurts | Fix |
|---|---|---|
| One giant span for the whole run | You lose all step-level detail | Break it into a root span plus one per meaningful step |
| A span for every tiny function | Traces get noisy and slow to read | Only trace model calls, tools, retrieval, and APIs |
| No version tag on the trace | You can’t tell which release caused an issue | Attach the agent version to every trace |
| Retries go untracked | They quietly add time and cost | Log retry count as its own number |
| Only measuring speed | A fast wrong answer looks “fine” | Track outcome alongside latency |
What to watch once it’s live
You don’t need fifty dashboards. A handful of numbers, checked regularly, catch most problems early:
| Metric | What a healthy range looks like | What a spike means |
|---|---|---|
| P95 latency | Roughly 2 to 3x your P50 | Something is inconsistently slow |
| Error rate | Under 2 to 3% | A tool or model provider is failing |
| Calls per trace | Stable week over week | The agent may be looping |
| Retry rate | Under 5% of runs | Something upstream is unreliable |
Once you’re tracking numbers like these across many agents, teams usually start asking bigger questions too, like which version is actually live, or whether output quality is slipping even though speed looks fine. OpenTelemetry gives you the raw signal for that. Platforms like Lyzr Agent Studio build on top of it to connect that data to the rest of an agent’s lifecycle, from building it to evaluating it to keeping watch on it in production.
At the end of the day, this isn’t about collecting more data for its own sake. It’s about being able to open one trace and actually know what your agent did, and why.
Book A Demo: Click Here
Join our Slack: Click Here
Link to our GitHub: Click Here